Key Points
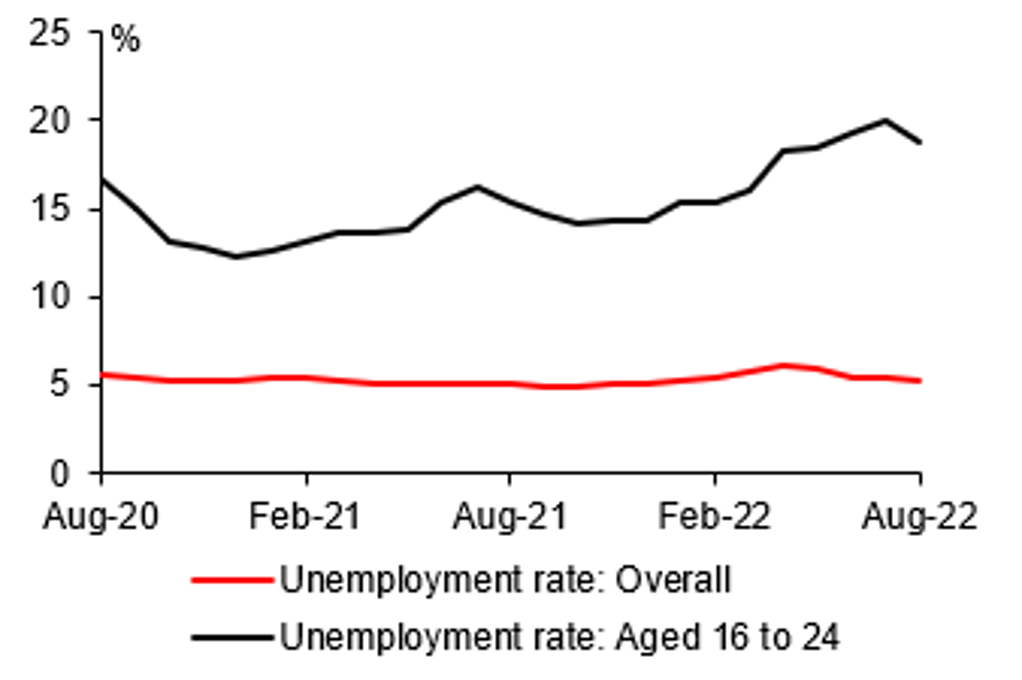
- Key economic indicators including IP, retail sales and FAI delivered accelerated and stronger than market consensus growths of 4.2%yoy, 5.4%yoy and 5.8%yoy respectively in August. And youth unemployment rate fell to 18.7% in August from a record high of 19.9% in July.
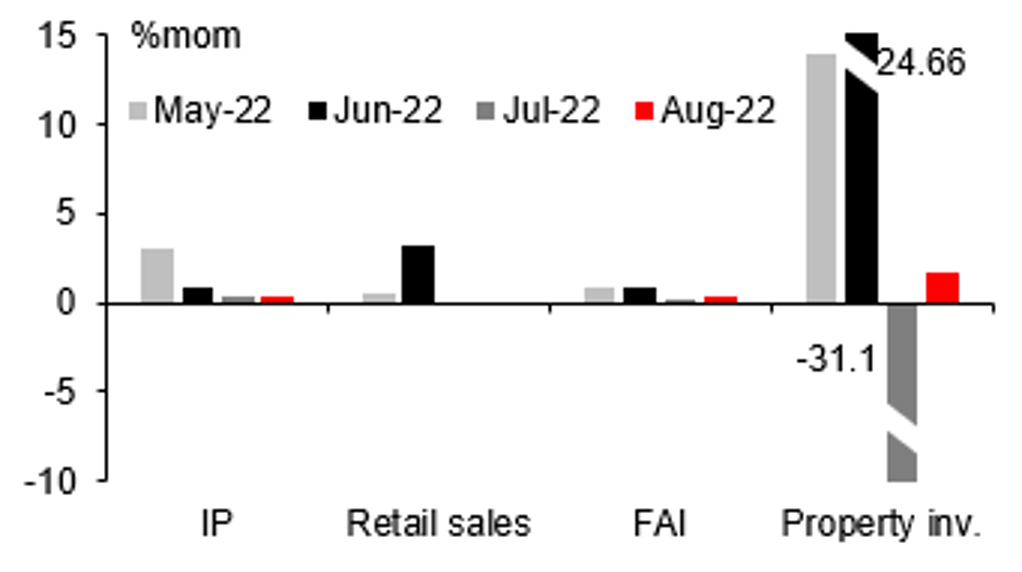
- Chinese economy remained on the recovery path in August, suggested by a larger m-o-m FAI change and a positive m-o-m change of IP. However the -0.05%mom change of retail sales in August implied a still weak appetite for consumption.
- Property sales improved marginally by 4.3%mom in August from weak July level. In light of government’s measures to promote "guaranteed handover” of properties, floor space completed increased by 42.5%mom, BUT, overall real estate sector remained as a drag for the economy, with significant negative y-o-y growths of property investment, sales, new floor space started.
- Both the widened gaps between M2 growth and M1 growth, and growth of social financing stock in August, indicate the still low risk appetite of households and corporates despite the various fiscal and monetary supports. Also, as a key pillar of China’s economy, exports growth slowed in August and likely remains on a declining trend amid a potential softer overseas demand, adding downside risk to the economy.
- We continue to expect a gradual improvement in China’s economic recovery pace towards the end of this year as various stimulus policies gradually exert positive impact, and more approaches will be rolled out to enhance a positive expectation of Chinese economy. USD/CNY is likely to strengthen towards year-end given divergent growth profile, after a short period of weakness in near term.
Growth momentum remained weak
Source: CEIC, MUFG GMR
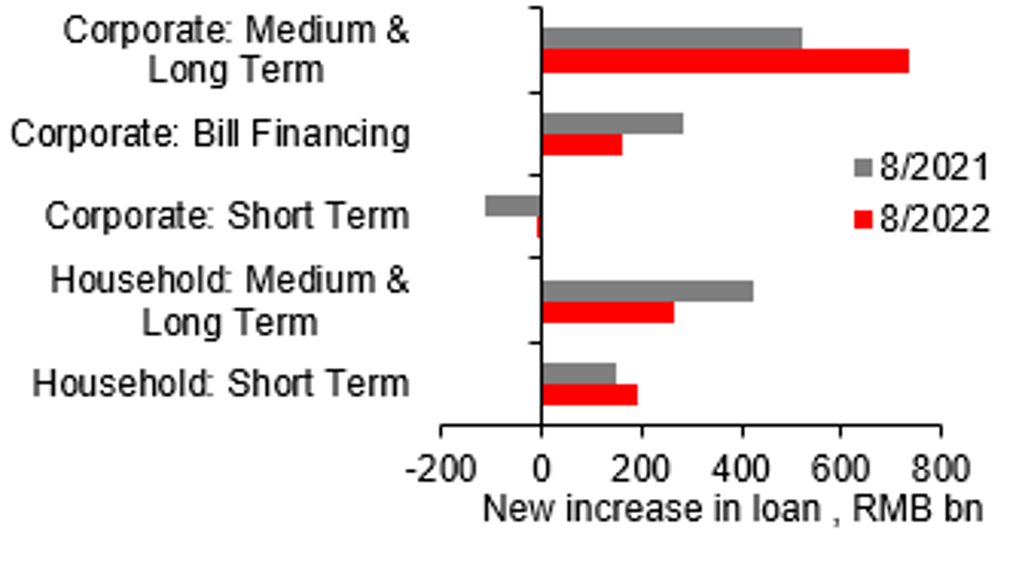
Lower medium- & longer-term household loan
Source: CEIC, MUFG GMR
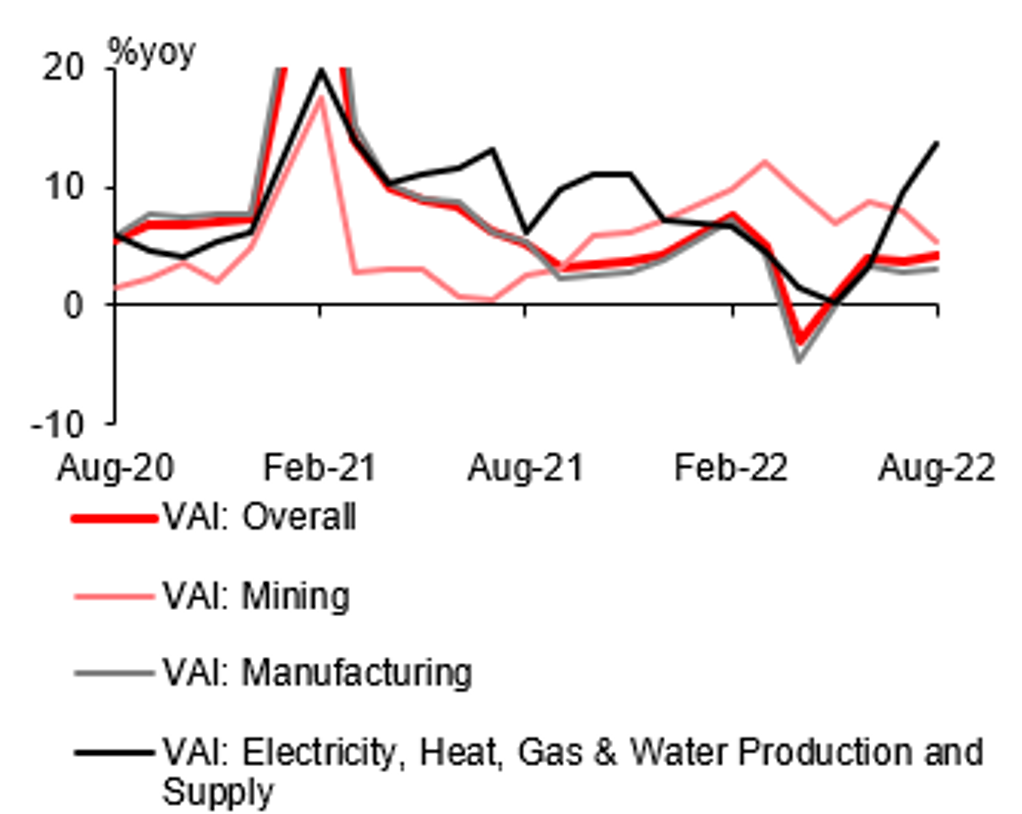
A pickup in year-over-year growth of industrial production this August. IP grew 4.2%yoy in August, up from a 3.8%yoy in July, due to stronger activities in manufacturing and electricity, heat, gas & water production and supply sector. Specifically, growth of value-added in manufacturing edged up to 3.1%yoy from prior’s 2.7%yoy, with automobile production backed by a reduction in a levy on auto purchases growing by 30.5%yoy in August after a 22.5%yoy increase in July, and growth of electricity, heat, gas & water production and supply accelerating to 13.6%yoy in August from 9.5%yoy in July, the biggest gain since March 2021. In contrast, growth of mining production slowed to 5.3%yoy in August from 8.1%yoy in July. Ownership-wise, growths of value-added in state-owned and foreign firms rose to 5.6%y and 4.0%yoy respectively, from 5.4%yoy and 1.9%yoy in July, while growths of value-added in private and share-holding enterprises slowed to 1.1%yoy and 4.1%yoy respectively, from 1.5%yoy and 4.4%yoy in July. That said, in sequential terms, IP growth slowed marginally to 0.32%mom in August from previous 0.38%mom.
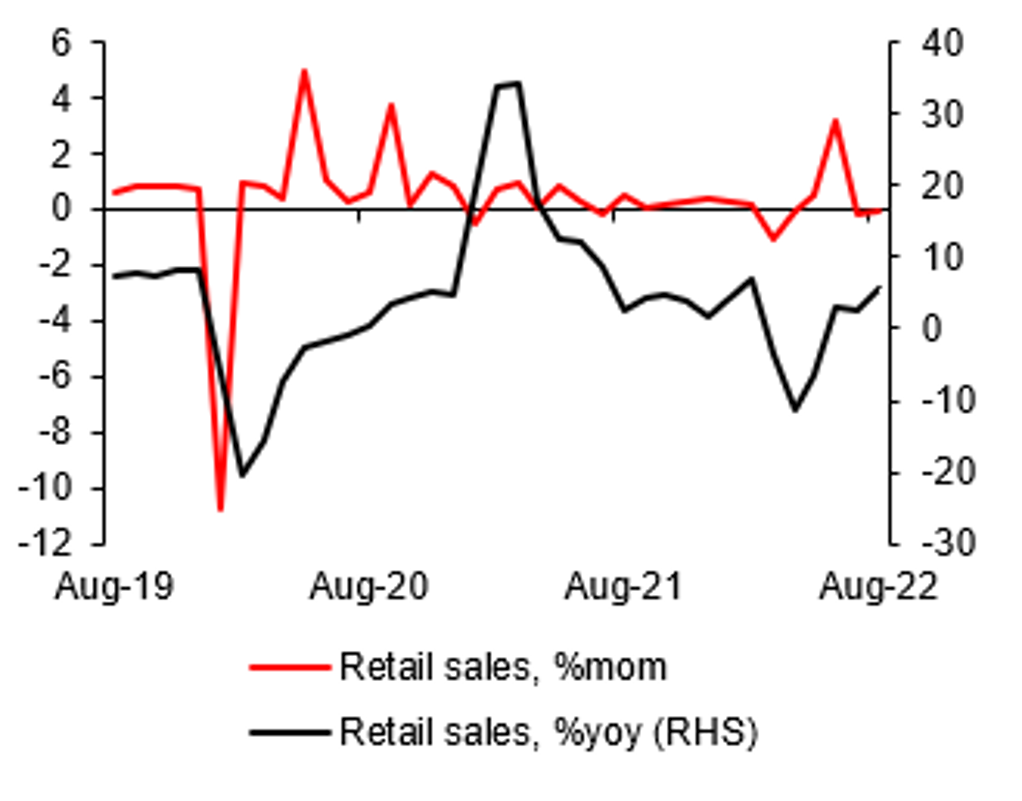
Retail sales remained weak in August. Retail sales growth rose to 5.4%yoy in August from 2.7%yoy in July, with commodity retail growth accelerating 1.9ppts to 5.1%yoy and catering expanding 8.4%yoy after a 1.5%yoy decline in the prior month and ending a five-month run of y-o-y contractions. However, in a month-on-month basis, retail sales contracted 0.05%mom after -0.12%mom in July.
Among sub-categories of commodity retail sales (above designated sized enterprises), automobile sales was the main driver this August, growing by 15.9%yoy after a 9.7%yoy growth in July. Y-o-y growth acceleration was also seen for grain, oil & food (+1.9ppts), beverage (+2.8ppts), tobacco & liquor (+0.3ppts), clothing, shoes, hats & textile (+4.3ppts), daily use goods (+2.9ppts), Chinese & western medicine (+1.3ppts), and petroleum & related product (+2.9ppts). Going the other way, cosmetics (-7.1ppts), Gold, silver & jewelry (-14.9ppts), household electric & video appliance (-3.7ppts), cultural & office goods (-5.3ppts), furniture (-1.8ppts), communication appliance (-9.5ppts) and construction & decoration material (-1.3ppts) showed growth deceleration in August.
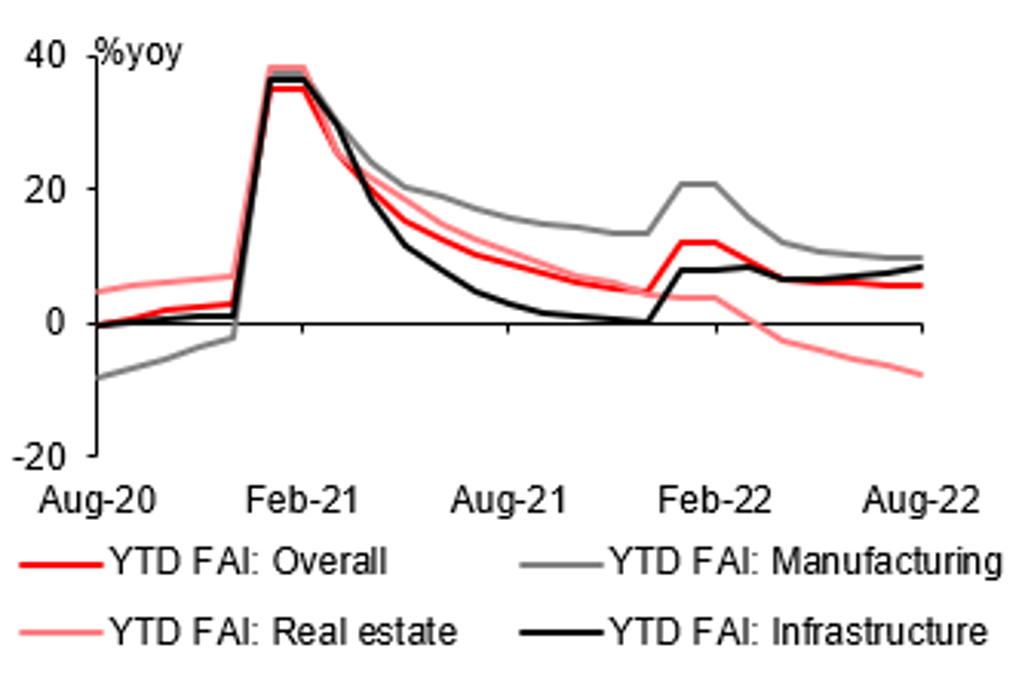
August’s FAI benefited from manufacturing and infrastructure FAI. YTD FAI growth ticked up to 5.8%yoy in August from July’s 5.7%yoy, with growth of YTD manufacturing FAI rising 0.1ppts to 10.0%yoy and YTD infrastructure FAI’s growth edging up by 0.9ppts to 8.3%yoy. In contrast, real estate sector remained the drag to the overall FAI this August, with growth of YTD real estate FAI declining by 1ppt to -7.4%yoy, marking the fifth consecutive month of contraction and indicating the continued weak sentiment in the property market. Growth deceleration still happened in private FAI, growth of YTD private FAI declined to 2.3%yoy in August from 2.7%yoy in July, reflecting its much weaker investment sentiment than that of stated-owned sector.
Notably, FAI also improved on a monthly basis, recording a 0.36%mom change after a 0.15%mom change in July, reflecting strong government spending on infrastructure.
Activities of property sector remained weak, but floor space completed rebounded strongly on policy measures
New home sales in 70 cities fell for the twelve straight months, with a -0.29%mom in August, and property investment dropped 13.8%yoy in August after a 12.3%yoy decline in July. While negative y-o-y growths continued to be seen in property sales and activity indicators, as well as various sources of funds this August, slight growth acceleration was still seen in property sales (+8.3ppts), floor space sold (+6.3ppts), floor space completed (+33.5ppts), domestic loan (+19.2ppts), foreign investment (+114.4ppts), self-raised (+2.2ppts), deposits & advanced payment (+5.2ppts) and mortgage (+4.3ppts).
In a month-on-month basis, property investment rose 1.8%mom in August after contracting 31.1%mom in July.
Notably, floor space completed had a relatively strong improvement in both m-o-m and y-o-y terms, benefiting from the RMB200 billion worth of special loan for developer to complete unfinished homes.
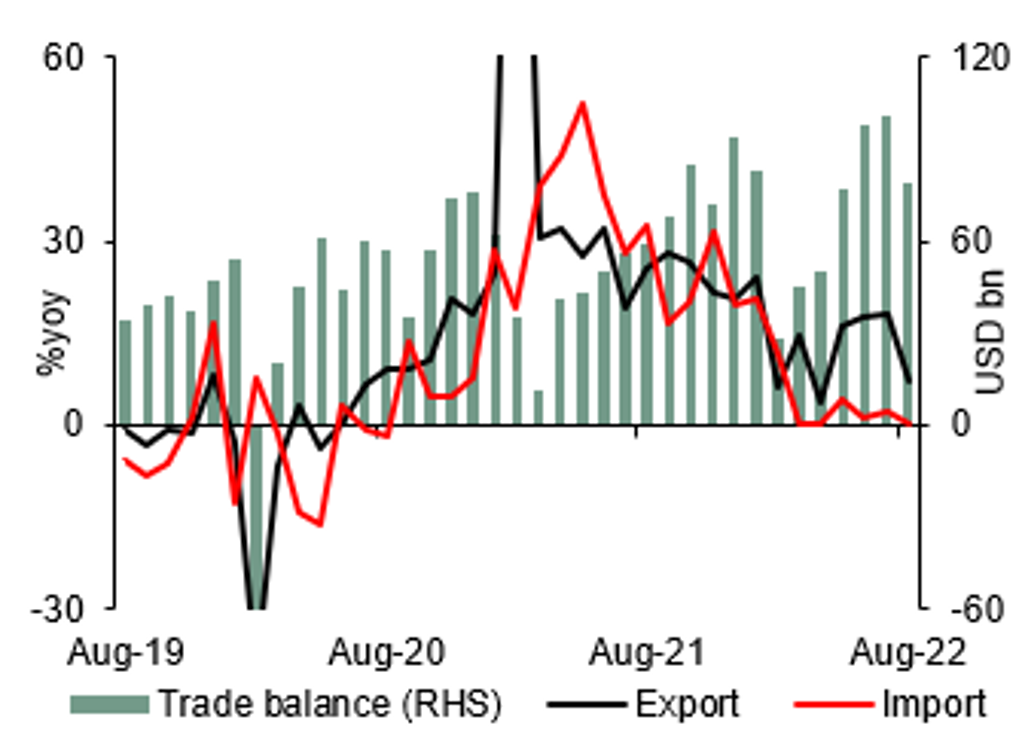
Slowdown in export growth this August signalled a weakening global outlook. China’s trade surplus (in USD terms) narrowed to USD79.39 bn in August after hitting a record-high of USD101.26 bn in the prior month, as exports growth declined to 7.1%yoy from July’s 18%yoy and imports growth dropped moderately to 0.3%yoy from 2.3%yoy in July. Region-wise, contribution of China’s major trading partners to the country’s overall yoy exports all declined this August, with US (-2.6ppts) falling the most, followed by EU (-1.8ppts) and ASEAN (-1.3ppts). Contribution from Japan, Hong Kong and South Korea slid by 0.5ppts, 0.3ppts and 0.5ppts respectively. Product-wise, mechanical and electrical products’ contribution fell by 5.1ppts to 2.6ppts and labour-intensive products made 3.0ppts less contribution to overall growth. Look ahead, we expect the country’s trade to remain under pressure amid likely recessions in both US and EU.
PPI and CPI inflations both eased in August. PPI inflation slowed to 2.3%yoy in August from 4.2%yoy in July. On a month-over-month basis, PPI inflation came in at -1.2%, falling for a second straight month, though less than the -1.3% in July. CPI inflation unexpectedly fell to 2.5% in August from 2.7%yoy in July, with core inflation remaining unchanged from July’s 0.8%yoy staying at or below 1.0%yoy for the fifth consecutive months. While food inflation sliding 0.2ppts to 6.1%yoy, pork prices increased 22.4%yoy this August, slightly above 20.2%yoy in the prior month. In month-over-month sequential change, headline CPI inflation fell 0.6ppts to -0.1%mom with core inflation falling 0.1ppts to 0.0% and food inflation dropping 2.5ppts to 0.5%. Notably, pork prices rose merely 0.4%mom, far less than a 25.6%mom rise in July. The unexpected moderation in consumer inflation clearly indicated the weak demand amid renewed Covid-19 control restrictions across China.
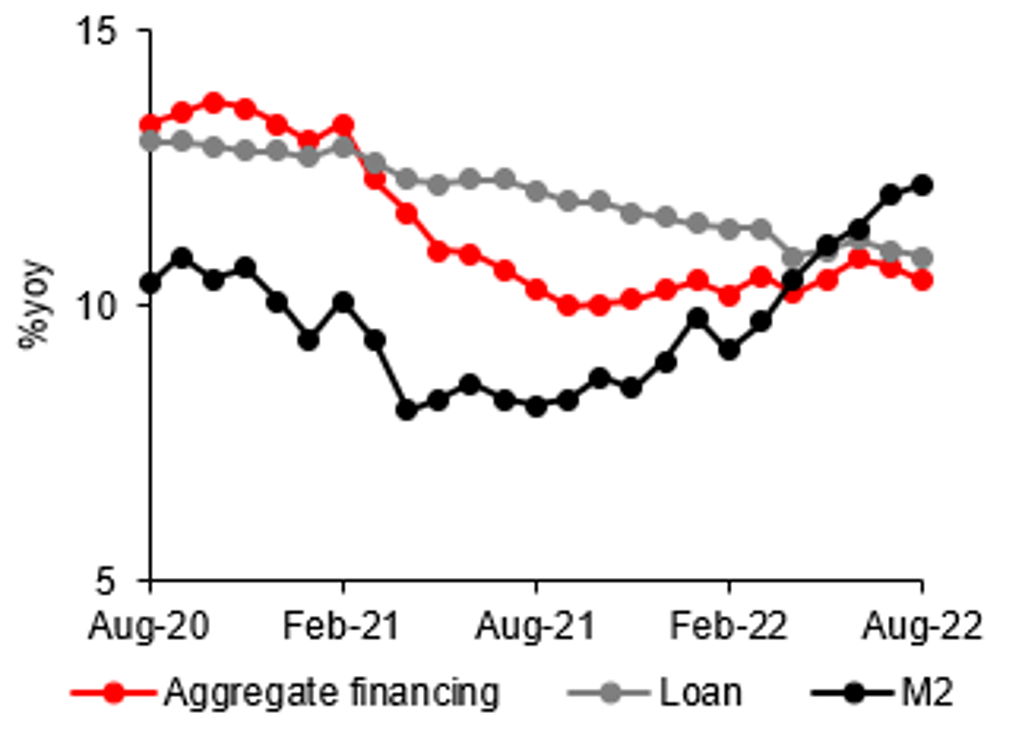
August aggregate financing was still well below what it was in 2021, due to weak corporate and government bond issuances. The growth of M2 rose to 12.2%yoy in August from July’s 12.0%yoy while aggregate financing stock grew by 10.5%yoy up from a 10.7%yoy growth in July. The new increased aggregate financing was RMB559.3 billion lower than that of last August and was RMB2.43 trillion this August, The new increased corporate bond and government bond financing were RMB350.1 billion and RMB669.3 billion lower than their respective levels in the same month last year, dragging on the aggregate financing in the month. August numbers clearly indicated that weak credit demand continued to be depressed by Covid-19 controls measures and market’s weak sentiment towards the property market, along with fading fiscal support after local governments have spent most of annual bond quotas earlier in the year.
The rebound in corporate medium and long-term loans suggests signs of improvement in China’s credit structure, but housing demand for mortgage remained weak. Loan stock growth edged down to 10.9%yoy this August from 11.0%yoy in the prior month. The new increased loan was RMB1.25 trillion, RMB30 billion higher than last August, with overall (household and corporate combined) new increased short-term & billing financing and medium- & long-term financing being RMB23.2 billion and RMB53.7billion higher than the level in August 2021 respectively. While corporate medium & long -term loan showing improvement, with new increase being RMB213.8 billion higher than last August, new increase household medium & long-term loan was RMB160.1 billion lower than last August, reflecting demand for mortgages was still low.
Overall IP growth rose in August
Source: CEIC, MUFG GMR
Overall YTD FAI edged up this August
Source: CEIC, MUFG GMR
Export growth dropped sharply in August
Source: CEIC, MUFG GMR
Retail sales growth rose in August
Source: CEIC, MUFG GMR
Youth jobless rate fell this August
Source: CEIC, MUFG GMR
Loan growth continued to fall in August
Source: CEIC, MUFG GMR
Summary of China Economic data
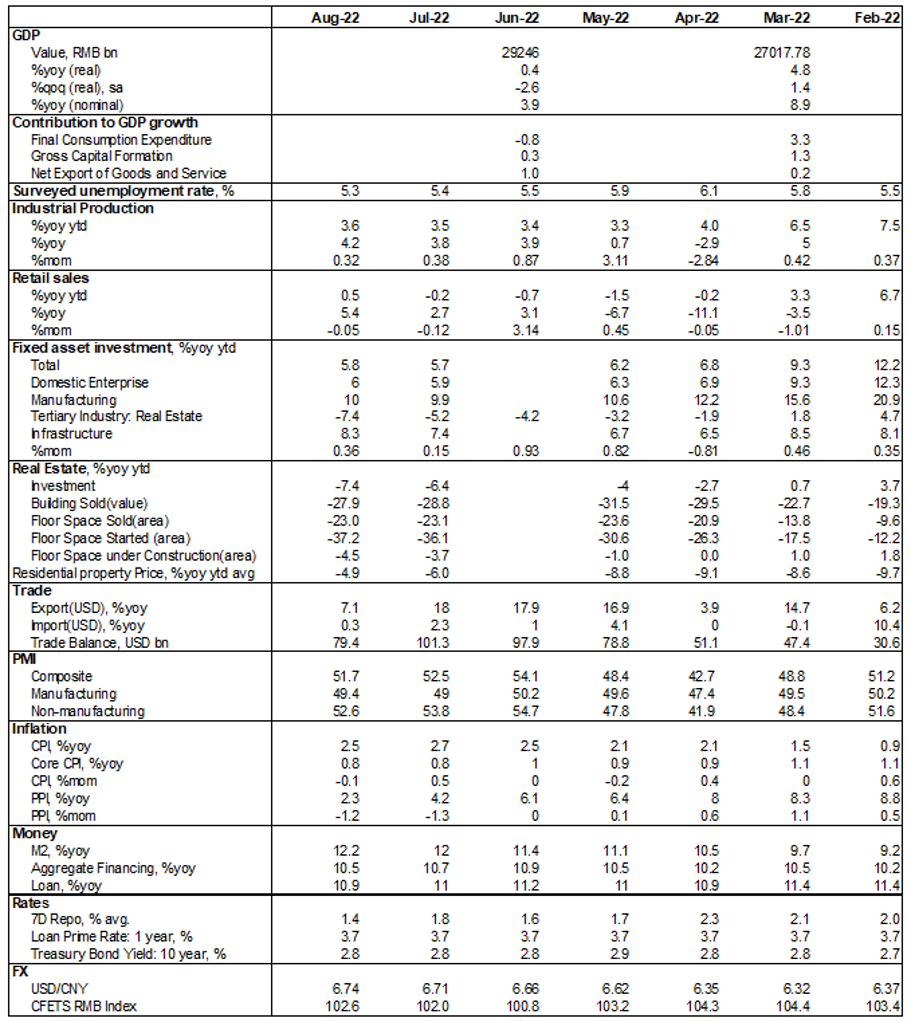
Source: CEIC, MUFG GMR. * : Property investment YTD.