

Please download PDF from above for the following currencies.
Australian dollar // New Zealand dollar //Canadian dollar // Norwegian krone // Swedish Krona // Swiss franc // Czech koruna // Hungarian forint //Polish zloty // Romanian leu // Russian rouble // South African rand // Turkish lira // Indian rupee // Indonesian rupiah // Malaysian ringgit // Philippine peso //Singapore dollar // South Korean won // Taiwan dollar // Thai baht // Vietnamese dong // Argentine peso // Brazilian real // Chilean peso // Mexican peso // Saudi riyal // Egyptian pound
Monthly Foreign Exchange Outlook
DEREK HALPENNY
Head of Research, Global Markets EMEA and International Securities
Global Markets Research
Global Markets Division for EMEA
E: derek.halpenny@uk.mufg.jp
LEE HARDMAN
Senior Currency Analyst
Global Markets Research
Global Markets Division for EMEA
E: lee.hardman@uk.mufg.jp
LIN LI
Head of Global Markets Research Asia
Global Markets Research
Global Markets Division for Asia
E: lin_li@hk.mufg.jp
KHANG SEK LEE
Associate
Global Markets Research
Global Markets Division for Asia
E: khangsek_lee@hk.mufg.jp
MICHAEL WAN
Senior Currency Analyst
Global Markets Research
Global Markets Division for Asia
E: michael_wan@sg.mufg.jp
LLOYD CHAN
Senior Currency Analyst
Global Markets Research
Global Markets Division for Asia
E: lloyd_chan@sg.mufg.jp
SOOJIN KIM
Analyst, ESG and Emerging Markets Research – EMEA
DIFC Branch – Dubai
E: soojin.kim@ae.mufg.jp
MUFG Bank, Ltd.
A member of MUFG, a global financial group
September 2026
KEY EVENTS IN THE MONTH AHEAD
1) EVERY G10 CENTRAL BANK MEETS
The US dollar declined by 0.4% in August, the second consecutive month of decline with the July drop driven by joint yen buying intervention by Japan and the US. The main catalyst for the drop in August was US policy related again, this time the UST bond buyback announcement by the US Treasury on 19th August. The drop in August would have been larger were it not for the Jackson Hole speech by Fed Chair Warsh that lifted expectations of a rate hike. The FOMC meeting will be the key central bank event in September (16th) – a month in which every G10 central bank will meet. The probability of a Fed hike is now at over 60% but the nonfarm payrolls report (4th) and the CPI report (11th) will now be key for shaping that key policy decision. The RBNZ and the Bank of Canada are first up on 2nd Sept with the RBNZ close to fully priced to deliver a 25bp hike. The ECB will follow on 10th Sept and is expected to deliver a 25bp hike. The day after the Fed, the BoE is scheduled to meet with the markets nearly fully pricing no change in policy. The BoJ meets on 18th Sept and like with the RBNZ and ECB is nearly fully priced for a 25bp hike. The following week Norges bank, the Riksbank and the SNB all meet on 24th Sept with Norges bank pricing of a hike similar to the pricing for the Fed (60%). The busy month for G10 central banks closes out with the RBA meeting on 29th Sept – a hike by the RBA is close to 50% priced and will likely be determined by data from Australia throughout the month.
2) MIDDLE EAST RISKS LINGER AS ENERGY PRICES RISE
Brent crude oil advanced only marginally in August but there were bigger increases in natural gas prices suggesting not as much supply is getting out of the Strait of Hormuz coupled with increasing demand in Europe with storage levels at extreme lows for this time of the year. TTF natural gas in Europe jumped 20% in August and from the low in late June is up by 73%. The level of natural gas prices are above both assumptions made by the BoE and ECB raising upside risks to inflation. At the end of August there was also a re-escalation of the conflict between the US and Iran and with no obvious end in sight to the conflict, there is an increasing risk of more substantial rises over the coming months. Refinery outages have also picked up markedly due to the Russia-Ukraine conflict with diesel prices rising sharply. The European average pump diesel price has rebounded by over 20% since early July and is close to the highs set in April.
3) TRUMP-XI SUMMIT ON 24TH SEPTEMBER
The 24th September Trump-Xi summit in Washington is shaping up as the most important US-China diplomatic event of 2026. Whether the two sides can stabilise relations, reduce policy uncertainty and avoid escalation in areas such as trade, technology restrictions, AI cooperation, and geopolitical issues, remain the market’s top focuses. A major breakthrough still appears unlikely, but even improved communication and limited progress on certain key concerns would help sentiment, and prove modestly supportive for the renminbi and broader Asian FX.
Forecast rates against the US dollar - End-Q3 to End-Q2 2027
Spot close 28.08.26 | Q3 2026 | Q4 2026 | Q1 2027 | Q2 2027 | |
DXY | 99.565 | 100.190 | 98.070 | 96.530 | 96.200 |
JPY | 160.03 | 158.00 | 156.00 | 154.00 | 152.00 |
EUR | 1.1598 | 1.1500 | 1.1800 | 1.2000 | 1.2000 |
GBP | 1.3556 | 1.3450 | 1.3640 | 1.3790 | 1.3710 |
CNY | 6.7272 | 6.7000 | 6.6500 | 6.6000 | 6.6000 |
AUD | 0.7166 | 0.7100 | 0.7200 | 0.7300 | 0.7400 |
NZD | 0.5913 | 0.5800 | 0.5900 | 0.6000 | 0.6100 |
CAD | 1.3897 | 1.4100 | 1.3900 | 1.3800 | 1.3600 |
NOK | 9.3791 | 9.4780 | 9.3220 | 9.2500 | 9.2500 |
SEK | 9.5944 | 9.7390 | 9.5760 | 9.2500 | 9.0830 |
CHF | 0.8086 | 0.8130 | 0.7880 | 0.7670 | 0.7630 |
|
|
|
|
|
|
CZK | 20.805 | 20.960 | 20.250 | 19.830 | 19.750 |
HUF | 314.83 | 317.40 | 309.30 | 300.00 | 295.80 |
PLN | 3.7423 | 3.7570 | 3.6440 | 3.5670 | 3.5500 |
RON | 4.5316 | 4.5830 | 4.4920 | 4.4420 | 4.4670 |
RUB | 85.375 | 84.310 | 85.110 | 85.320 | 87.160 |
ZAR | 16.135 | 16.300 | 16.000 | 15.800 | 15.600 |
TRY | 48.240 | 49.000 | 51.500 | 53.500 | 55.500 |
|
|
|
|
|
|
INR | 95.380 | 95.500 | 95.500 | 96.000 | 96.500 |
IDR | 17689 | 18100 | 18350 | 18500 | 18700 |
MYR | 4.0230 | 4.0500 | 4.0300 | 4.0000 | 4.0000 |
PHP | 62.249 | 62.200 | 62.000 | 61.500 | 61.000 |
SGD | 1.2744 | 1.2800 | 1.2750 | 1.2700 | 1.2700 |
KRW | 1378.7 | 1380.0 | 1370.0 | 1360.0 | 1350.0 |
TWD | 31.609 | 31.500 | 31.400 | 31.000 | 30.700 |
THB | 33.103 | 33.500 | 34.100 | 34.000 | 33.800 |
VND | 26073 | 26050 | 26100 | 26200 | 26300 |
|
|
|
|
|
|
ARS | 1513.1 | 1540.0 | 1600.0 | 1655.0 | 1700.0 |
BRL | 5.2147 | 5.2500 | 5.1500 | 5.0000 | 4.9000 |
CLP | 927.85 | 930.00 | 915.00 | 880.00 | 870.00 |
MXN | 17.040 | 17.100 | 17.000 | 16.850 | 16.500 |
| |||||
SAR | 3.7543 | 3.7500 | 3.7500 | 3.7500 | 3.7500 |
EGP | 50.220 | 49.750 | 51.000 | 52.500 | 54.000 |
Notes: All FX rates are expressed as units of currency per US dollar bar EUR, GBP, AUD and NZD which are expressed as dollars per unit of currency. Data source spot close; Bloomberg closing rate as of 5:00pm London time, except VND which is local onshore closing rate. All consensus forecasts are Bloomberg sourced.
US dollar
Spot close 28.08.26 | Q3 2026 | Q4 2026 | Q1 2027 | Q2 2027 | |
USD/JPY | 160.03 | 158.00 | 156.00 | 154.00 | 152.00 |
EUR/USD | 1.1598 | 1.1500 | 1.1800 | 1.2000 | 1.2000 |
Consensus | Consensus | Consensus | Consensus | ||
USD/JPY | 159.00 | 158.00 | 156.00 | 155.00 | |
EUR/USD | 1.1600 | 1.1600 | 1.1700 | 1.1800 |
MARKET UPDATE
In August the US dollar weakened further against the euro in terms of London closing rates, from 1.1509 to 1.1598. However, the dollar strengthened against the yen, from 159.23 to 160.03. The FOMC did not meet in August and hence the range for the federal funds was unchanged at 3.50%-3.75%. The FOMC confirmed the end of QT effective December last year with the Fed no longer reducing UST bond holdings. MBS holdings continue to decline but are offset by buying of US T-bills, now estimated to be running at around USD 25bn per month.
OUTLOOK
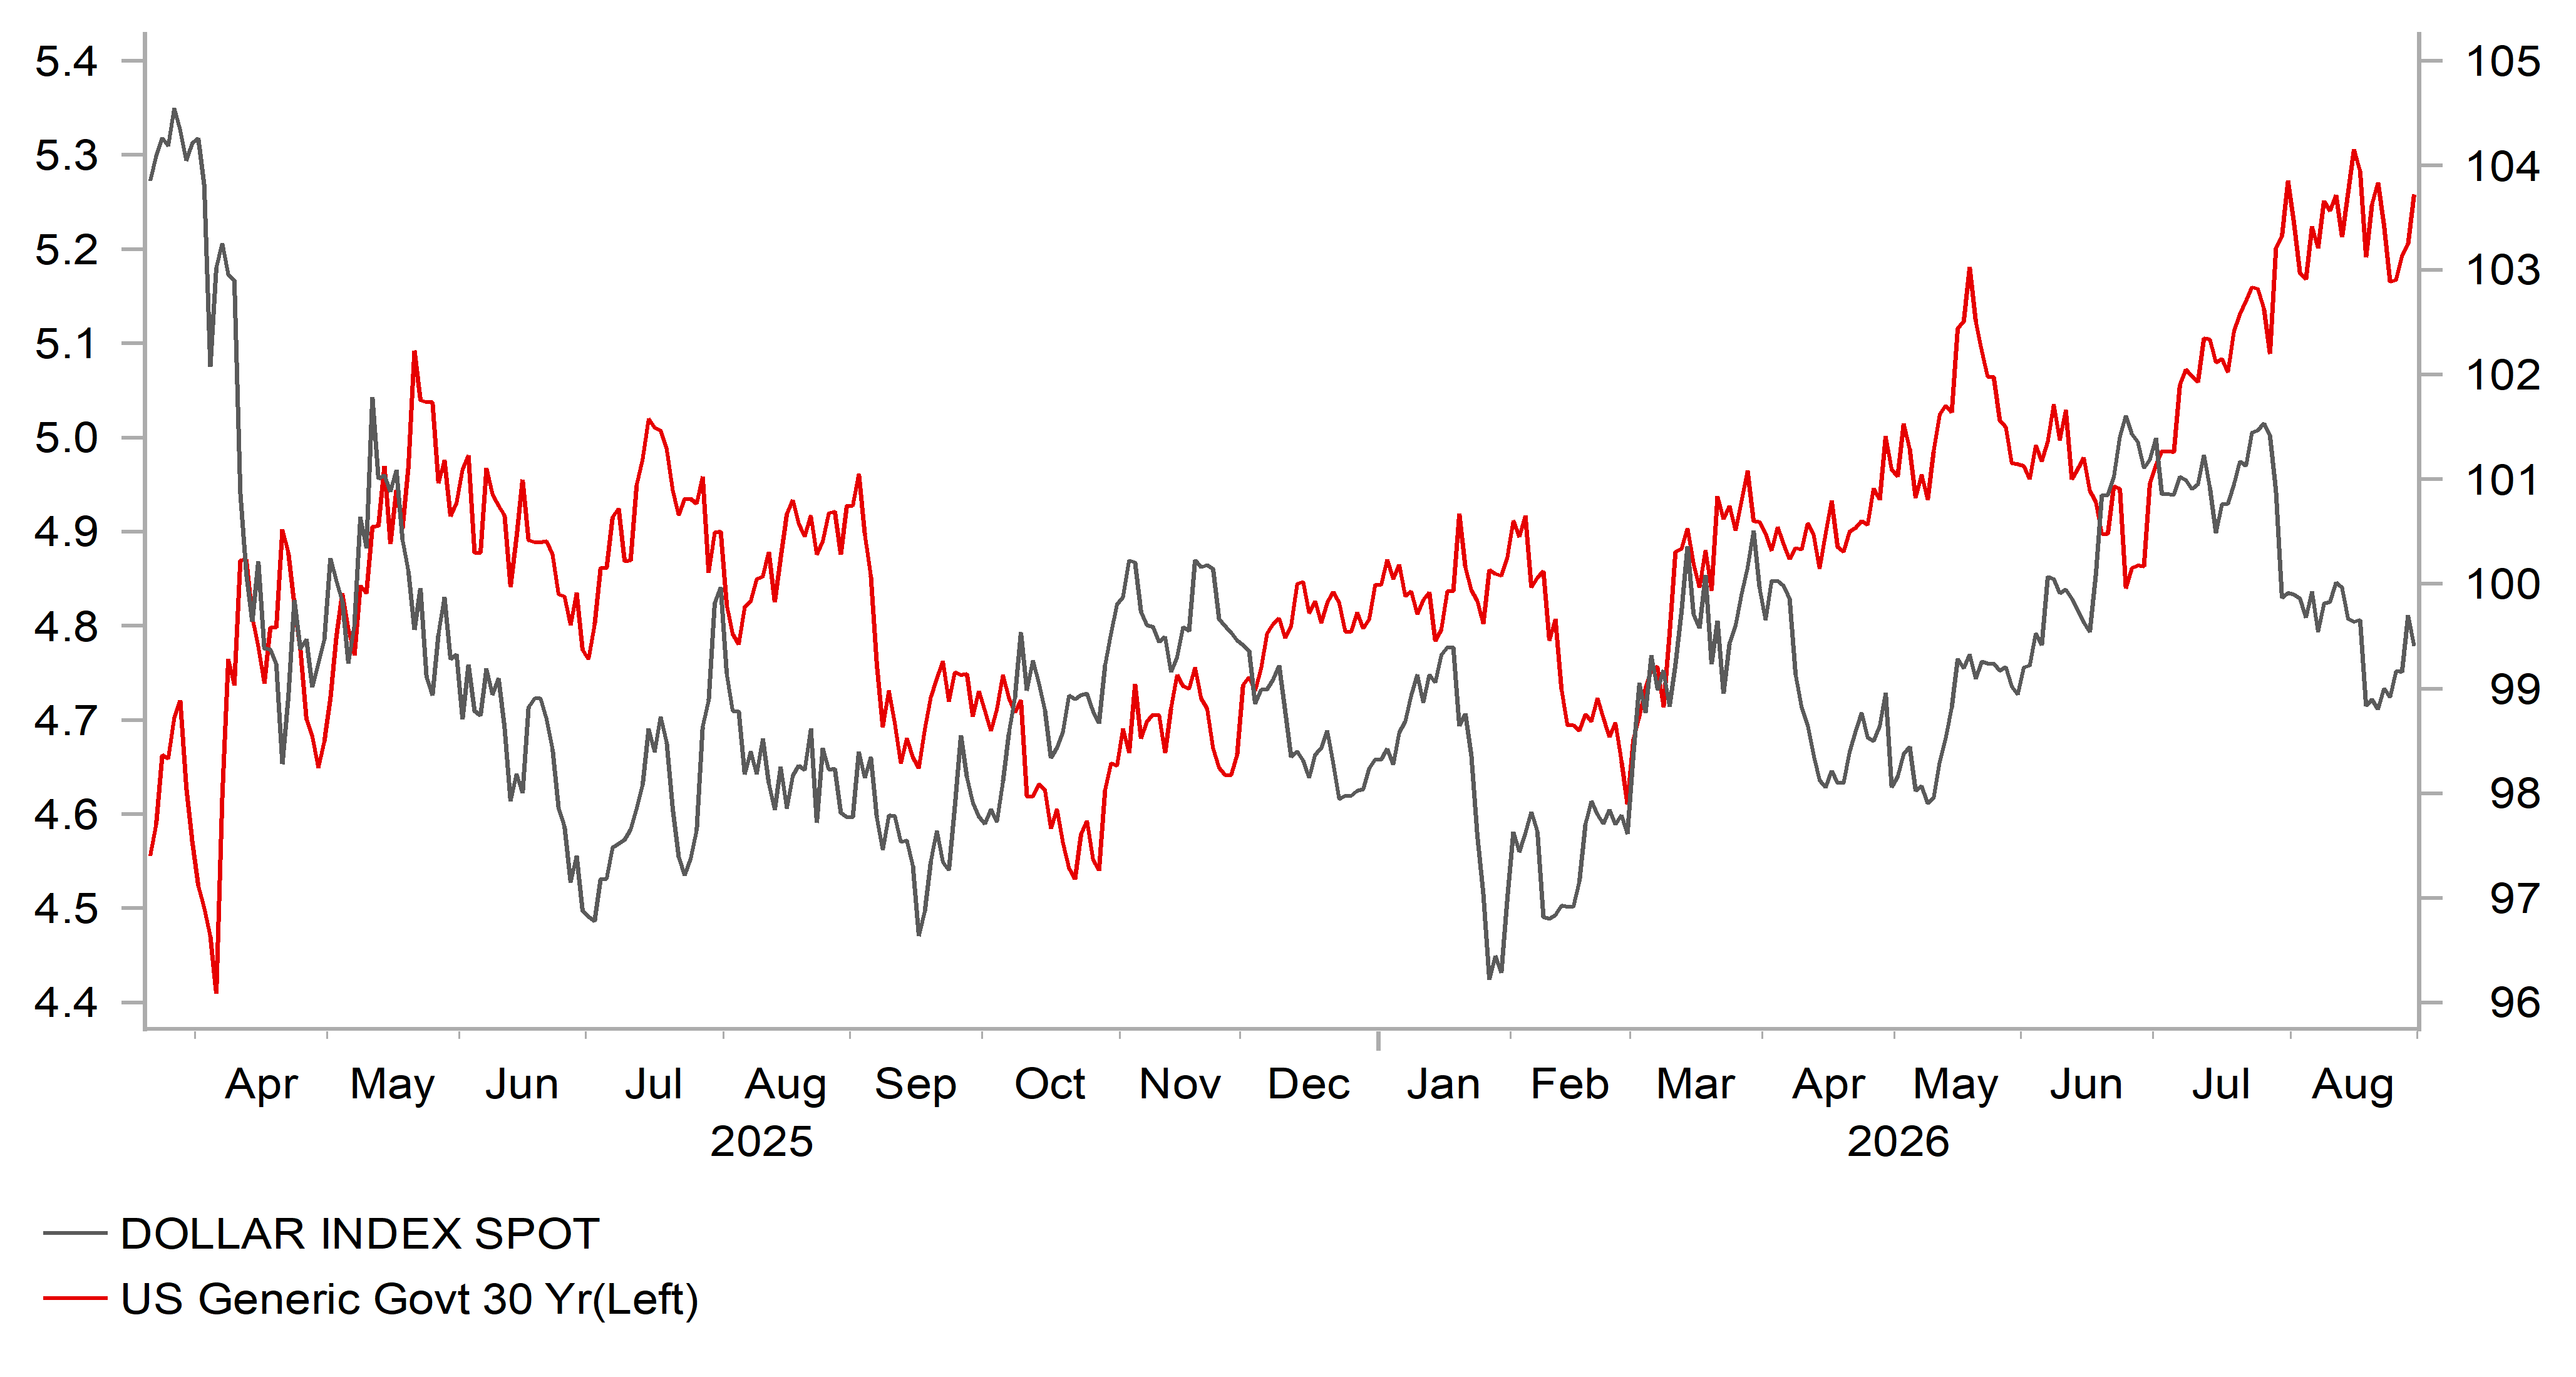
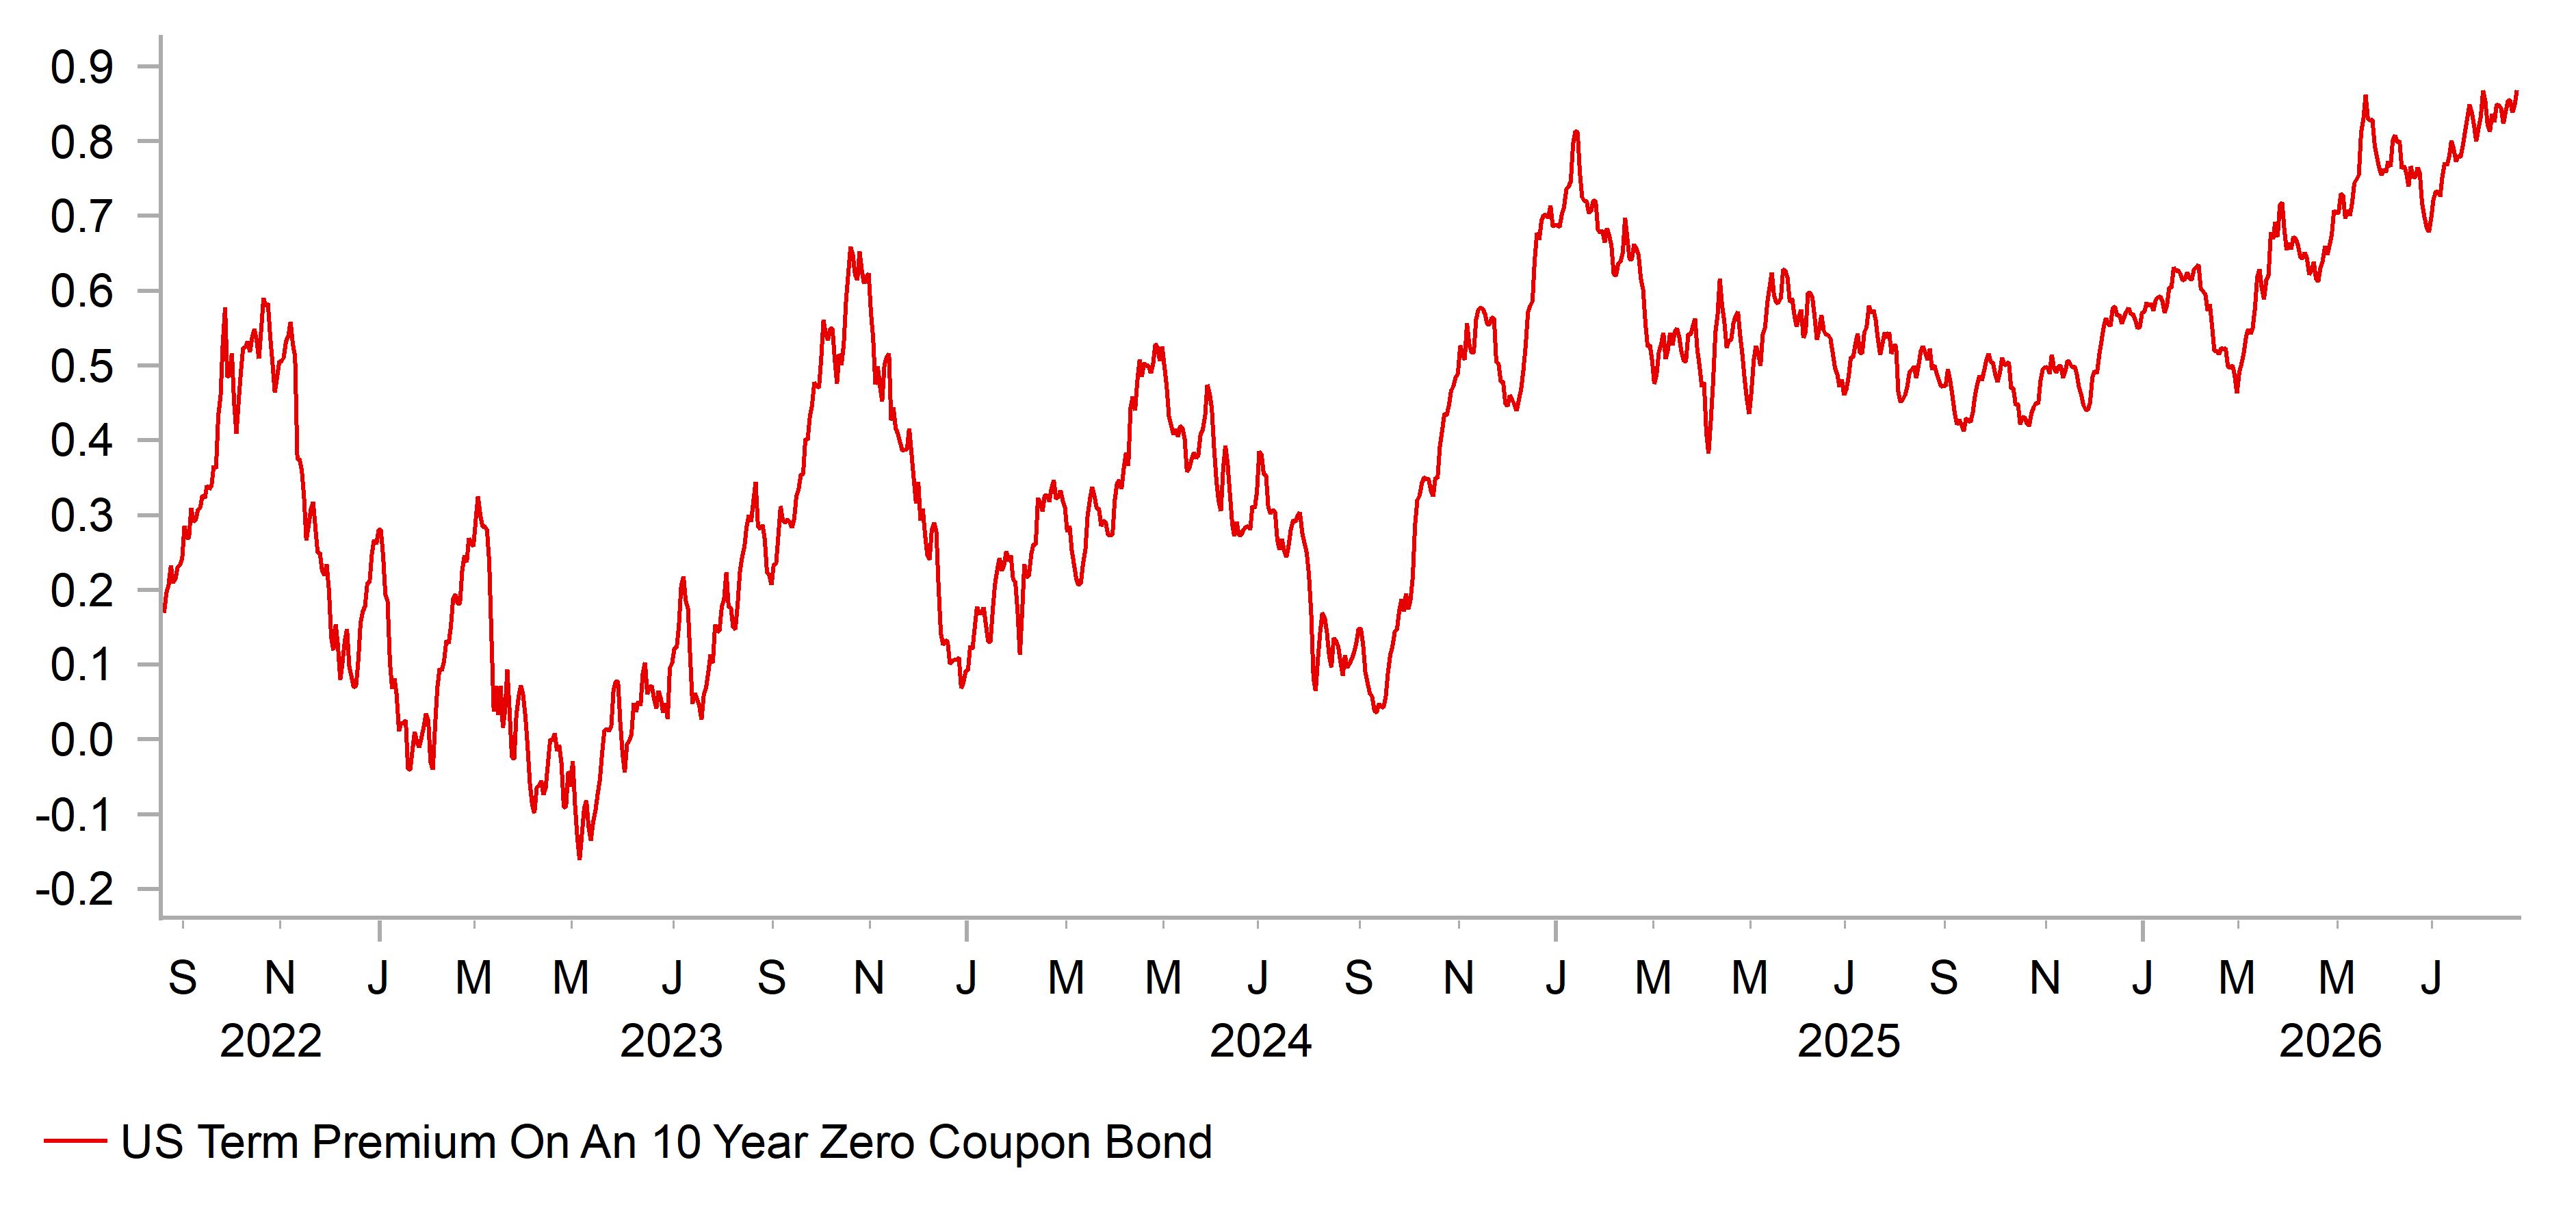
The US dollar depreciated in August, on a DXY basis the drop was 0.5%, driven primarily by the decision of the US Treasury to announce an increase to the scheduled buybacks of longer-term UST bonds. Understandably that triggered concerns of yields being distorted lower that resulted in an immediate drop in the dollar. Given this followed the decision to join Japan in buying the yen that was again related to keeping US yields lower (reducing Japan’s need to sell UST bonds to finance USD sales) investors are being given the impression of growing concerns in Washington over rising yields. Of course, without addressing the underlying reasons for rising yields (fiscal outlook and Fed’s reaction function in fighting inflation), yields could remain under upward pressure. Attempts to cap yields without addressing the fundamental factors behind the move does not instil confidence amongst global investors and the prospect of fiscal consolidation ahead of the mid-terms or even through the remainder of Trump’s term in office remains very low.
However, the US dollar debasement theme did not last too long with rising yields ultimately helping to provide support for the dollar. Pricing for a rate hike by the Fed in September jumped from about 35% to 60% following Warsh’s Jackson Hole speech. His comment that the Fed has “work to do” if inflation doesn’t move to the 2% inflation target “with sufficient speed” and his acknowledgement that financial conditions are not restrictive clearly points to an increased risk of a 25bp rate hike in September. There will be some uncertainty that will persist given there is another NFP and CPI data release before that meeting, but we now would likely need to see another weak NFP and CPI print and some further retracement of energy prices to provide the justification not to act. The decision to hike in September now looks like a very close call and a lot must go the same way for the Fed to remain on hold.
The decision to hike, if it happens, is unlikely to be a gamechanger for the dollar. Developments abroad also point to other central banks being more hawkish than we initially expected. A third rate hike from the ECB is becoming a bigger risk, a hike by the BoE, the RBA and Norges bank (all not fully priced) are possible either in September or by year-end and hence rate spreads are unlikely to move dramatically in favour of the dollar. We’d also assume it more likely than not that a Fed hike could prove a one-off based on our view of a decline in energy prices, weak jobs and CPI.
INTEREST RATE OUTLOOK
Interest Rate Close | Q3 2026 | Q4 2026 | Q1 2027 | Q2 2027 | |
Policy Rate | 3.63% | 3.63% | 3.63% | 3.38% | 3.13% |
3-Month T-Bill | 3.83% | 3.63% | 3.55% | 3.30% | 3.13% |
10-Year Yield | 4.75% | 4.50% | 4.38% | 4.25% | 4.13% |
* Interest rate assumptions incorporated into MUFG foreign exchange forecasts.
Chair Warsh has been speaking to markets with an ever increasingly hawkish tone (see link for recent Jackson Hole Recap). The market has been yearning for some insights into Warsh’s framework and might be misconstruing what we heard at Jackson Hole as forward guidance vs just a chair that is focused, in his words on “displine” but not one ready to make a “decision”. At the time of writing, ahead of critical US data that might be the final factors that drive a hike or a hold, the markets are pricing well over 50% that the Fed will hike at the September meeting. We acknowledge that every meeting now will be live, yet that requires that the inflation data doesn’t improve and/or the US jobs data needs to remain solid. This is why for us, NFP actually matters more before the Fed goes into blackout period. If we get another weak report that should reduce the odds of a hike back under 50%. We recently changed our Fed call to suggest the Fed remains on hold (see link) for the balance of 2026. However markets will continue to price in hikes (just like they used to price in cuts) until a new narrative comes our way. We think a rate hike at this stage of the cycle will ultimately be a policy error but if the data improves we reserve the right to reassess. (George Goncalves)
US 30-YEAR TREASURY YIELD VS. DXY
Source: Bloomberg, Macrobond & MUFG GMR
US 10YR TERM PREMIUM
Source: Bloomberg, Macrobond & MUFG GMR
Japanese yen
Spot close 28.08.26 | Q3 2026 | Q4 2026 | Q1 2027 | Q2 2027 | |
USD/JPY | 160.03 | 158.00 | 156.00 | 154.00 | 152.00 |
EUR/JPY | 185.60 | 181.70 | 184.10 | 184.80 | 182.40 |
Consensus | Consensus | Consensus | Consensus | ||
USD/JPY | 159.00 | 158.00 | 156.00 | 155.00 | |
EUR/JPY | 184.00 | 183.00 | 183.00 | 182.00 |
MARKET UPDATE
In August the yen weakened modestly versus the US dollar in terms of London closing rates from 159.23 to 160.03. In addition, the yen weakened versus the euro from 183.26 to 185.60. The BoJ did not meet in August and hence the key policy rate was unchanged at 1.00%, the highest level since 1995 following three 25bp hikes since January 2025. The BoJ continues to cut JGB monthly purchases at a pace of reduction of JPY 200bn per quarter through to Q1 2027 and will then halt the reduction with monthly purchases by then falling to JPY 2trn per month.
OUTLOOK
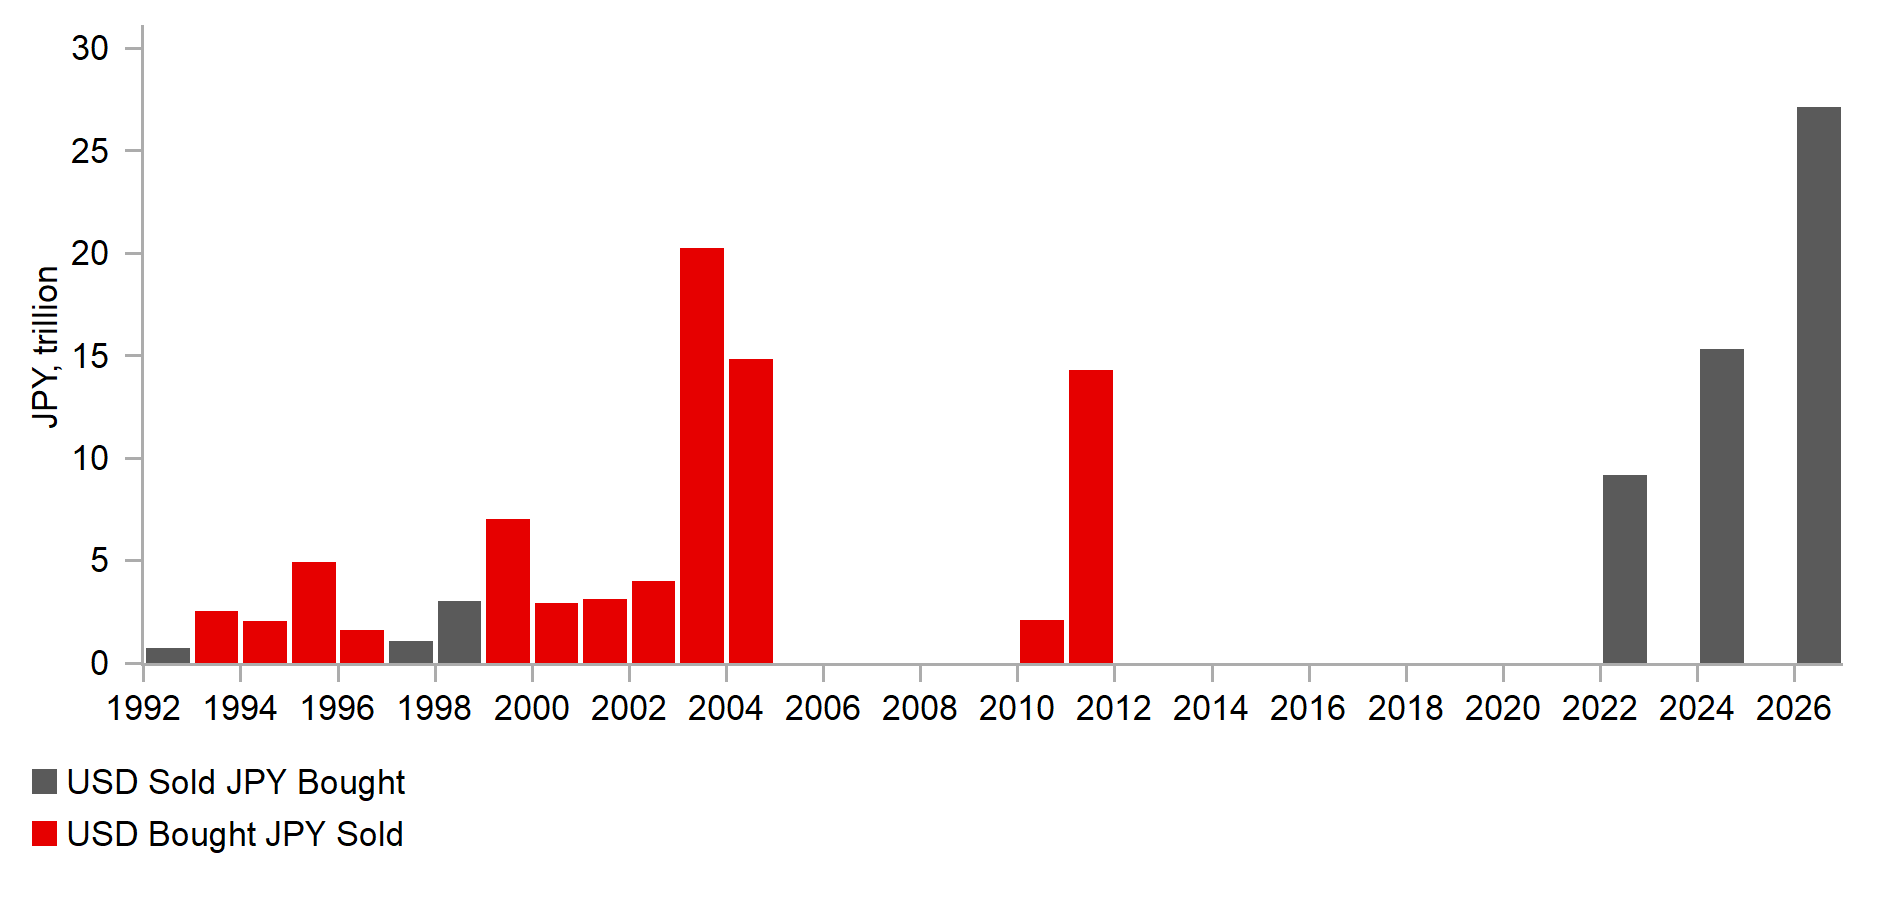
Intervention to buy the yen in late New York trading on 31st July saw the yen extend gains at the start of August but USD/JPY quickly retraced and August was more about stability with the range of 158.00-159.00 holding from 10th August until the final two days of the month. Joint intervention matters but policy matters more and doubts continue to linger on whether this joint action will lead to any coherent shift in economic policy in Japan. PM Takaichi is viewed as having a strong bias favouring a reflationist approach and hence concerns over the fiscal policy outlook is deterring a more notable gain for the yen. The near-term energy risks are likely also playing a role in limiting demand for the yen. After the start of the US-Iran conflict Japan turned to its oil reserves and energy imports in the period March to May remained relatively subdued. However, mineral fuel imports have surged with the July fuel import bill 60% higher than the average monthly bill between March and May.
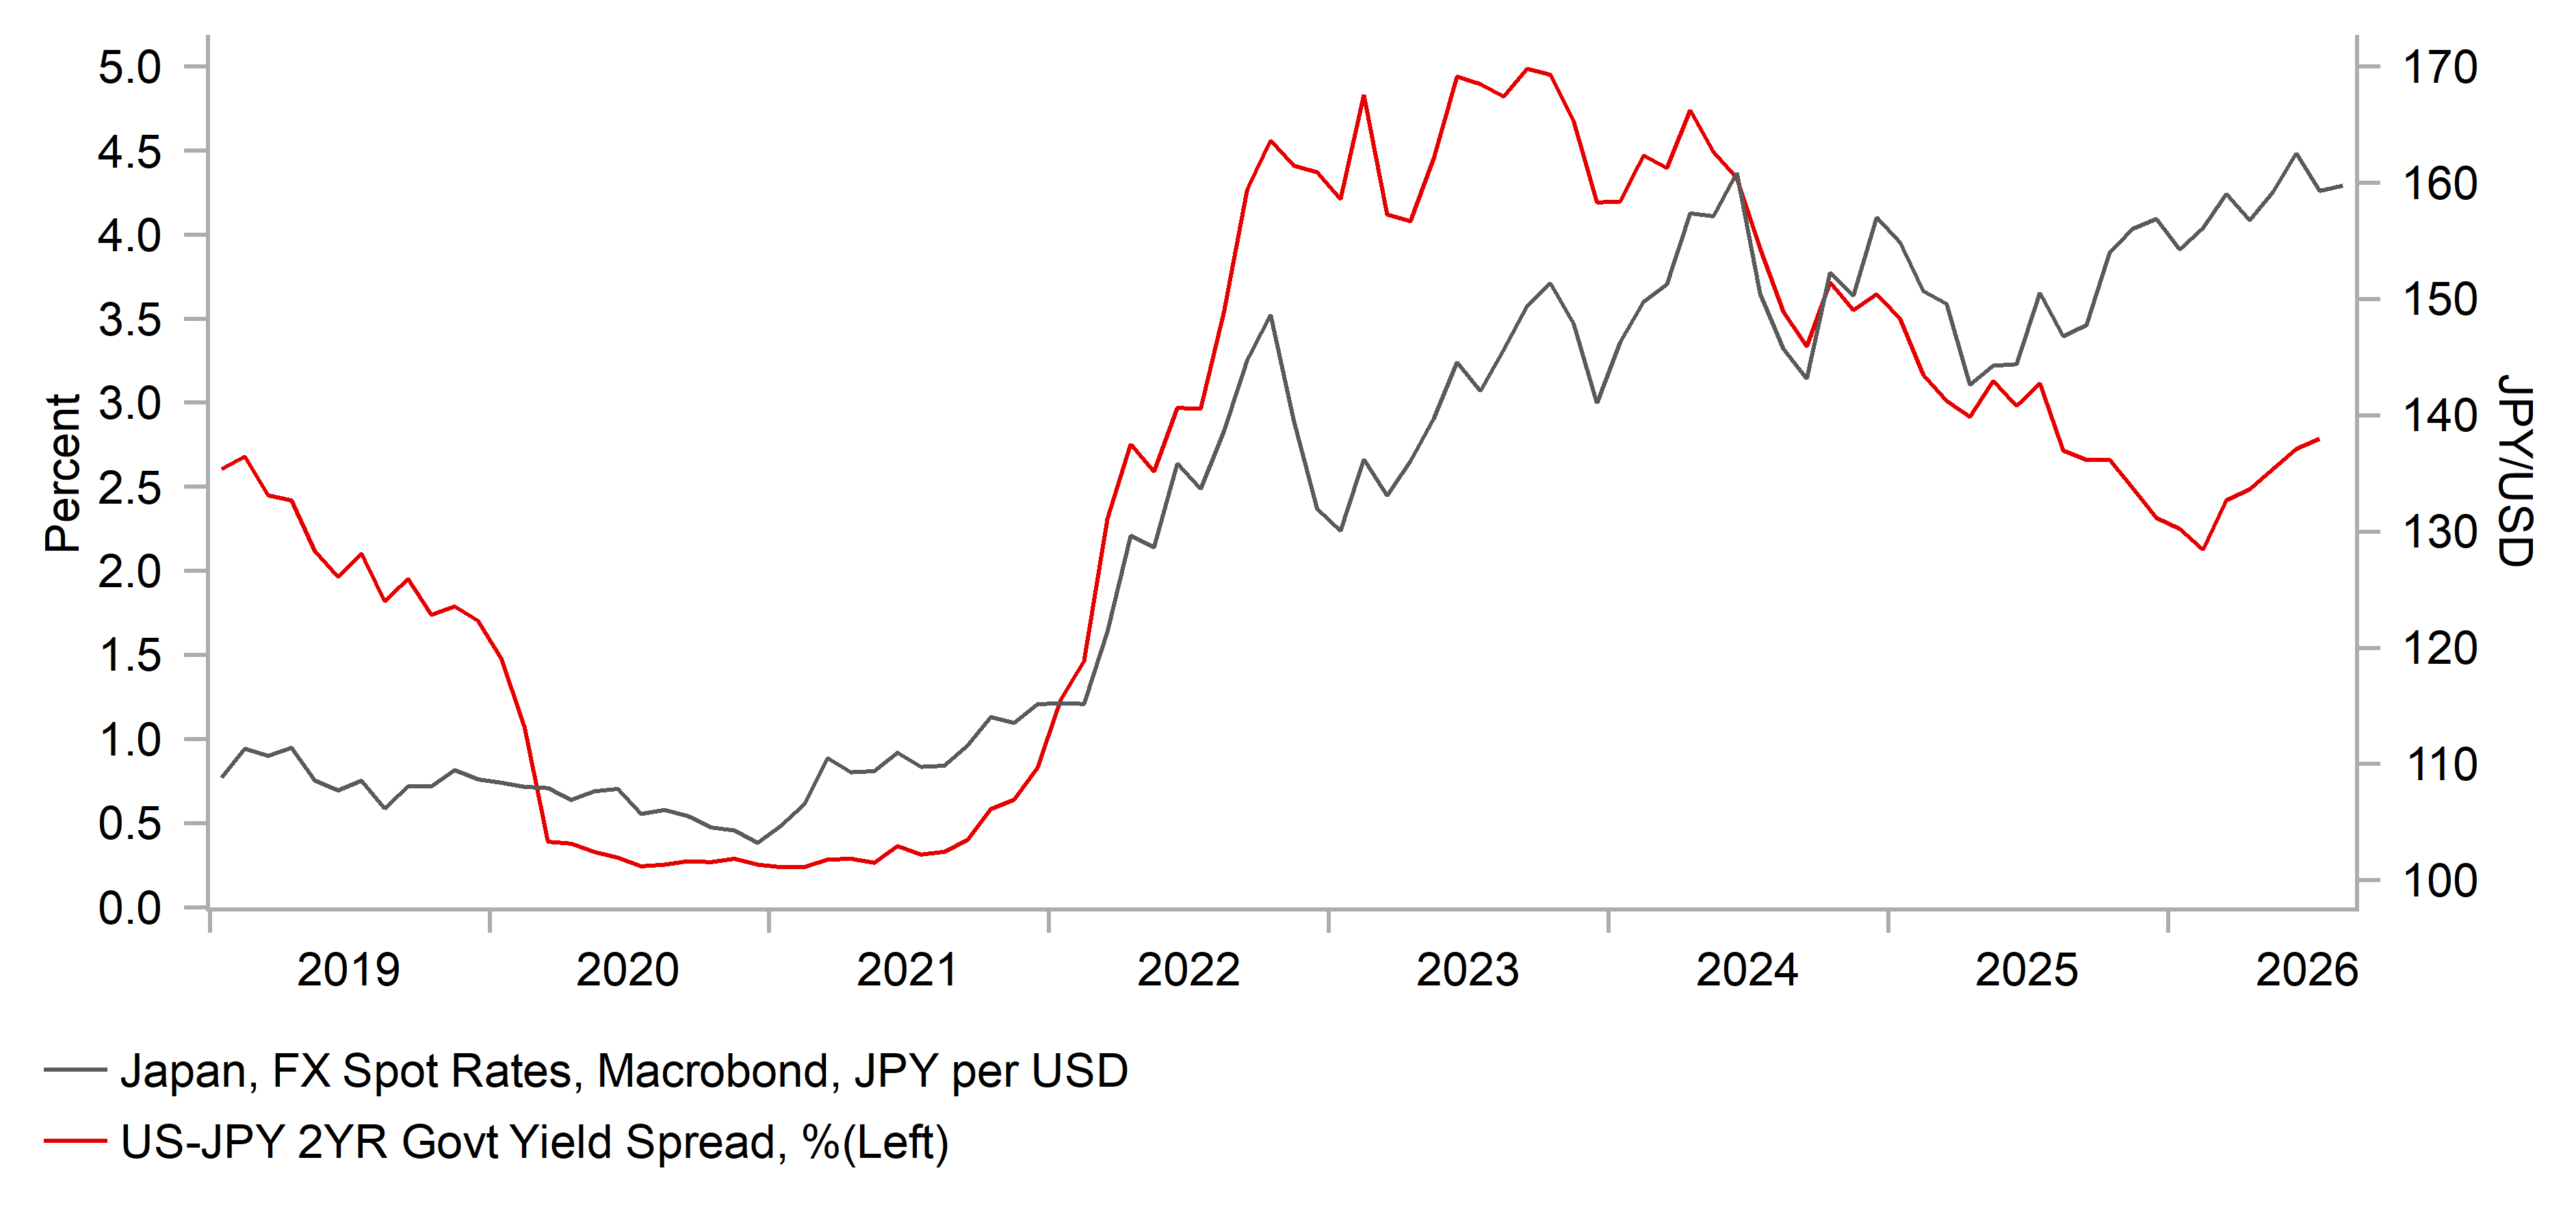
At the end of August the OIS market implied a 90% probability of a rate hike at the next meeting in September. By mid-2027 the market now expects the BoJ policy rate to reach 1.75%, perhaps around the mid-point of the previously cited R* range of between -1.0% and +0.5%. Deputy Governor Himino gave a speech and despite offering no explicit guidance on a hike was clearly on the hawkish side and effectively endorsed current market pricing. But the issue for the yen is the speed of getting to neutral and given it is so drawn out – at least another year based on current pricing – there is a perception amongst investors of a reluctance to lift rates to that level or even an ability to do it given the implications on the cost of servicing Japan’s debt. That uncertainty raises fears over ‘fiscal dominance’ – when monetary policy is dictated not by the inflation outlook but by the constraints of the debt burden. So the quarterly pace of hiking (June/September) is not priced to continue and that reflects to a degree the continued caution of the BoJ. The BoJ forecasts core nationwide CPI at 2.4% in FY2027 while the OIS market implies a policy rate of 2.25% in two years pointing to a negative real policy rate over all that period.
A BoJ rate hike in September is nearly fully priced and two further hikes by mid-2027 are also priced. Hence action in September won’t be a big driver of yen strength. For USD/JPY the removal of the Fed tightening priced in the curve will help USD/JPY move lower, but Japan factors will contain the extent of any move lower
INTEREST RATE OUTLOOK
Interest Rate Close | Q3 2026 | Q4 2026 | Q1 2027 | Q2 2027 | |
Policy Rate | 1.00% | 1.25% | 1.25% | 1.50% | 1.75% |
3-Month Bill | 1.08% | 1.10% | 1.30% | 1.50% | 1.80% |
10-Year Yield | 2.96% | 2.90% | 2.80% | 2.80% | 2.70% |
* Interest rate assumptions incorporated into MUFG foreign exchange forecasts.
The 10-year JGB yield increased against in August, by 15bps to close at 2.96%, the highest monthly close since 1997. Deputy Governor Himino’s speech in August certainly indicated the willingness of the BoJ to speed up the pace of monetary tightening. But that flexibility is two-way and it remains unclear how quickly the BoJ will act to get to the neutral rate that we see at around 1.75%-2.00%. The appraoch of this level should certainly help flatten the yield curve and improved confidence in JGBs should see the multi-year grind higher in 10-year yields come to a halt. The JGB yield move lower also reflects our global view of lower yields across G10 driven primarily by lower UST bond yields. There is also some uncertainty over the outlook of monetary policy in the second half of next year. Naoki Tamura and Hajime Takata are both scheduled to leave the policy board in July 2027 when their terms expire and PM Takaichi is likely to replace the two most hawkish board members with more dovish reflationists. In theory that could make it more difficult to vote through further rate hikes making it important to have the policy stance near neutral by then.
USD/JPY VS US-JP 2YR
Source: Bloomberg & MUFG GMR
JAPAN FX INTERVENTION
Source: Bloomberg, Macrobond & MUFG GMR
Euro
Spot close 28.08.26 | Q3 2026 | Q4 2026 | Q1 2027 | Q2 2027 | |
EUR/USD | 1.1598 | 1.1500 | 1.1800 | 1.2000 | 1.2000 |
EUR/JPY | 185.60 | 181.70 | 184.10 | 184.80 | 182.40 |
Consensus | Consensus | Consensus | Consensus | ||
EUR/USD | 1.1600 | 1.1600 | 1.1700 | 1.1800 | |
EUR/JPY | 184.00 | 183.00 | 183.00 | 182.00 |
MARKET UPDATE
In August the euro advanced further against the US dollar in terms of London closing rates from 1.1509 to 1.1598. The ECB did not meet in August and hence the deposit rate was unchanged at 2.25% - following the first hike since September 2023 in June. Balance sheet reduction continues with the ECB’s projected maturities from both APP and PEPP expected to result in a EUR 500bn decline in balance sheet holdings in 2026.
OUTLOOK
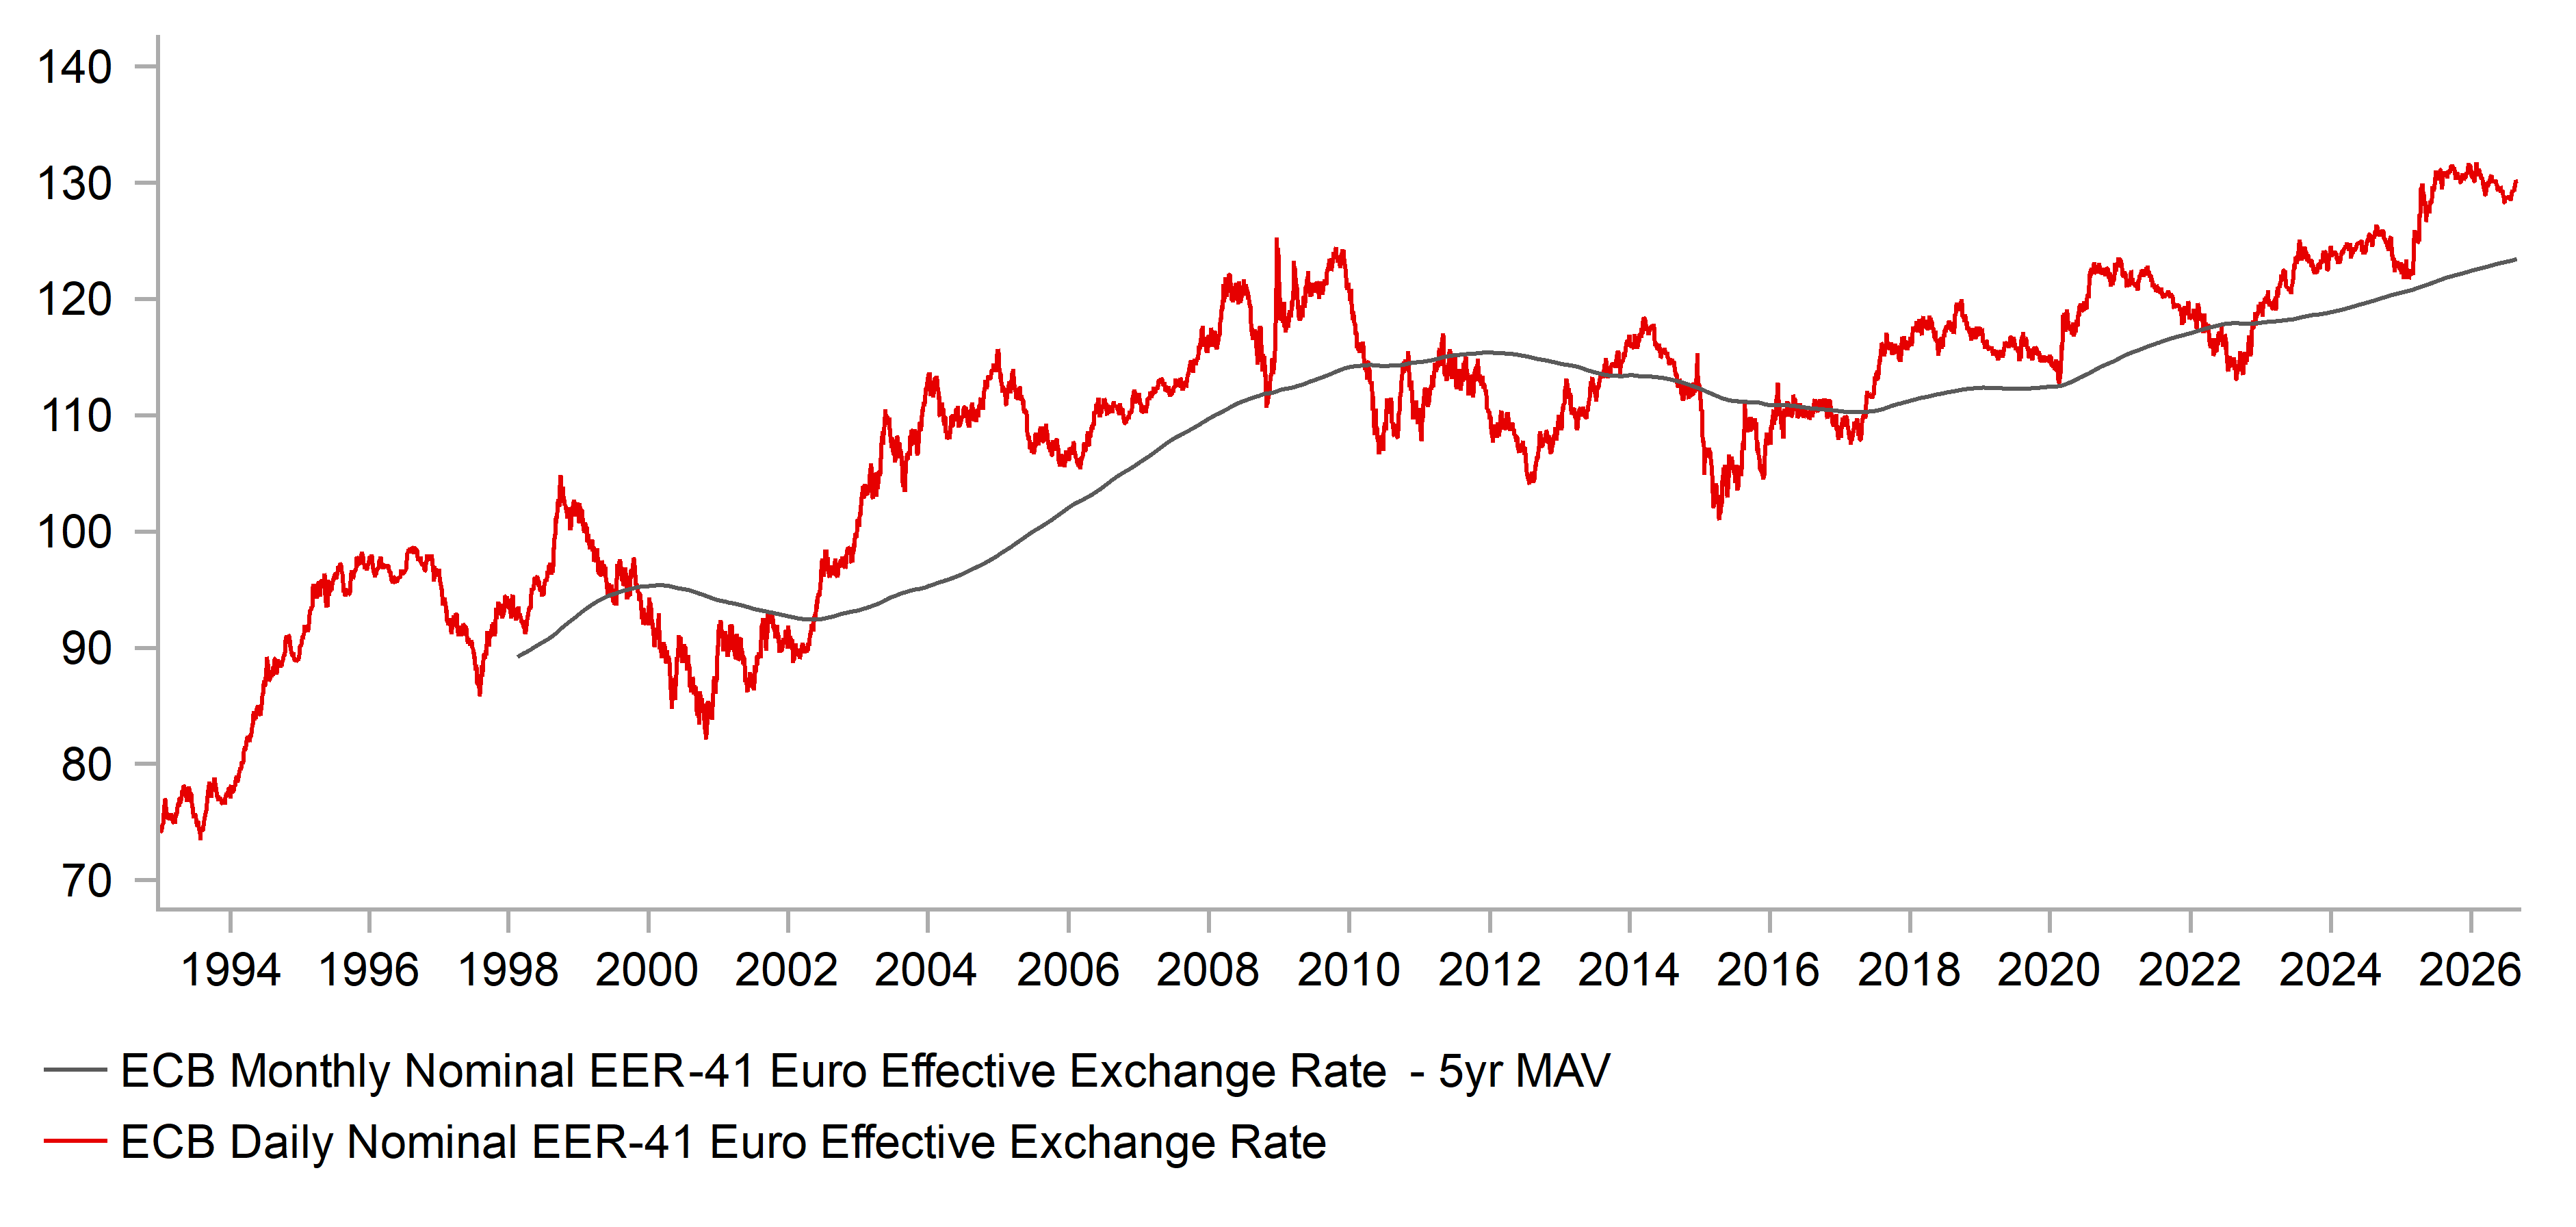
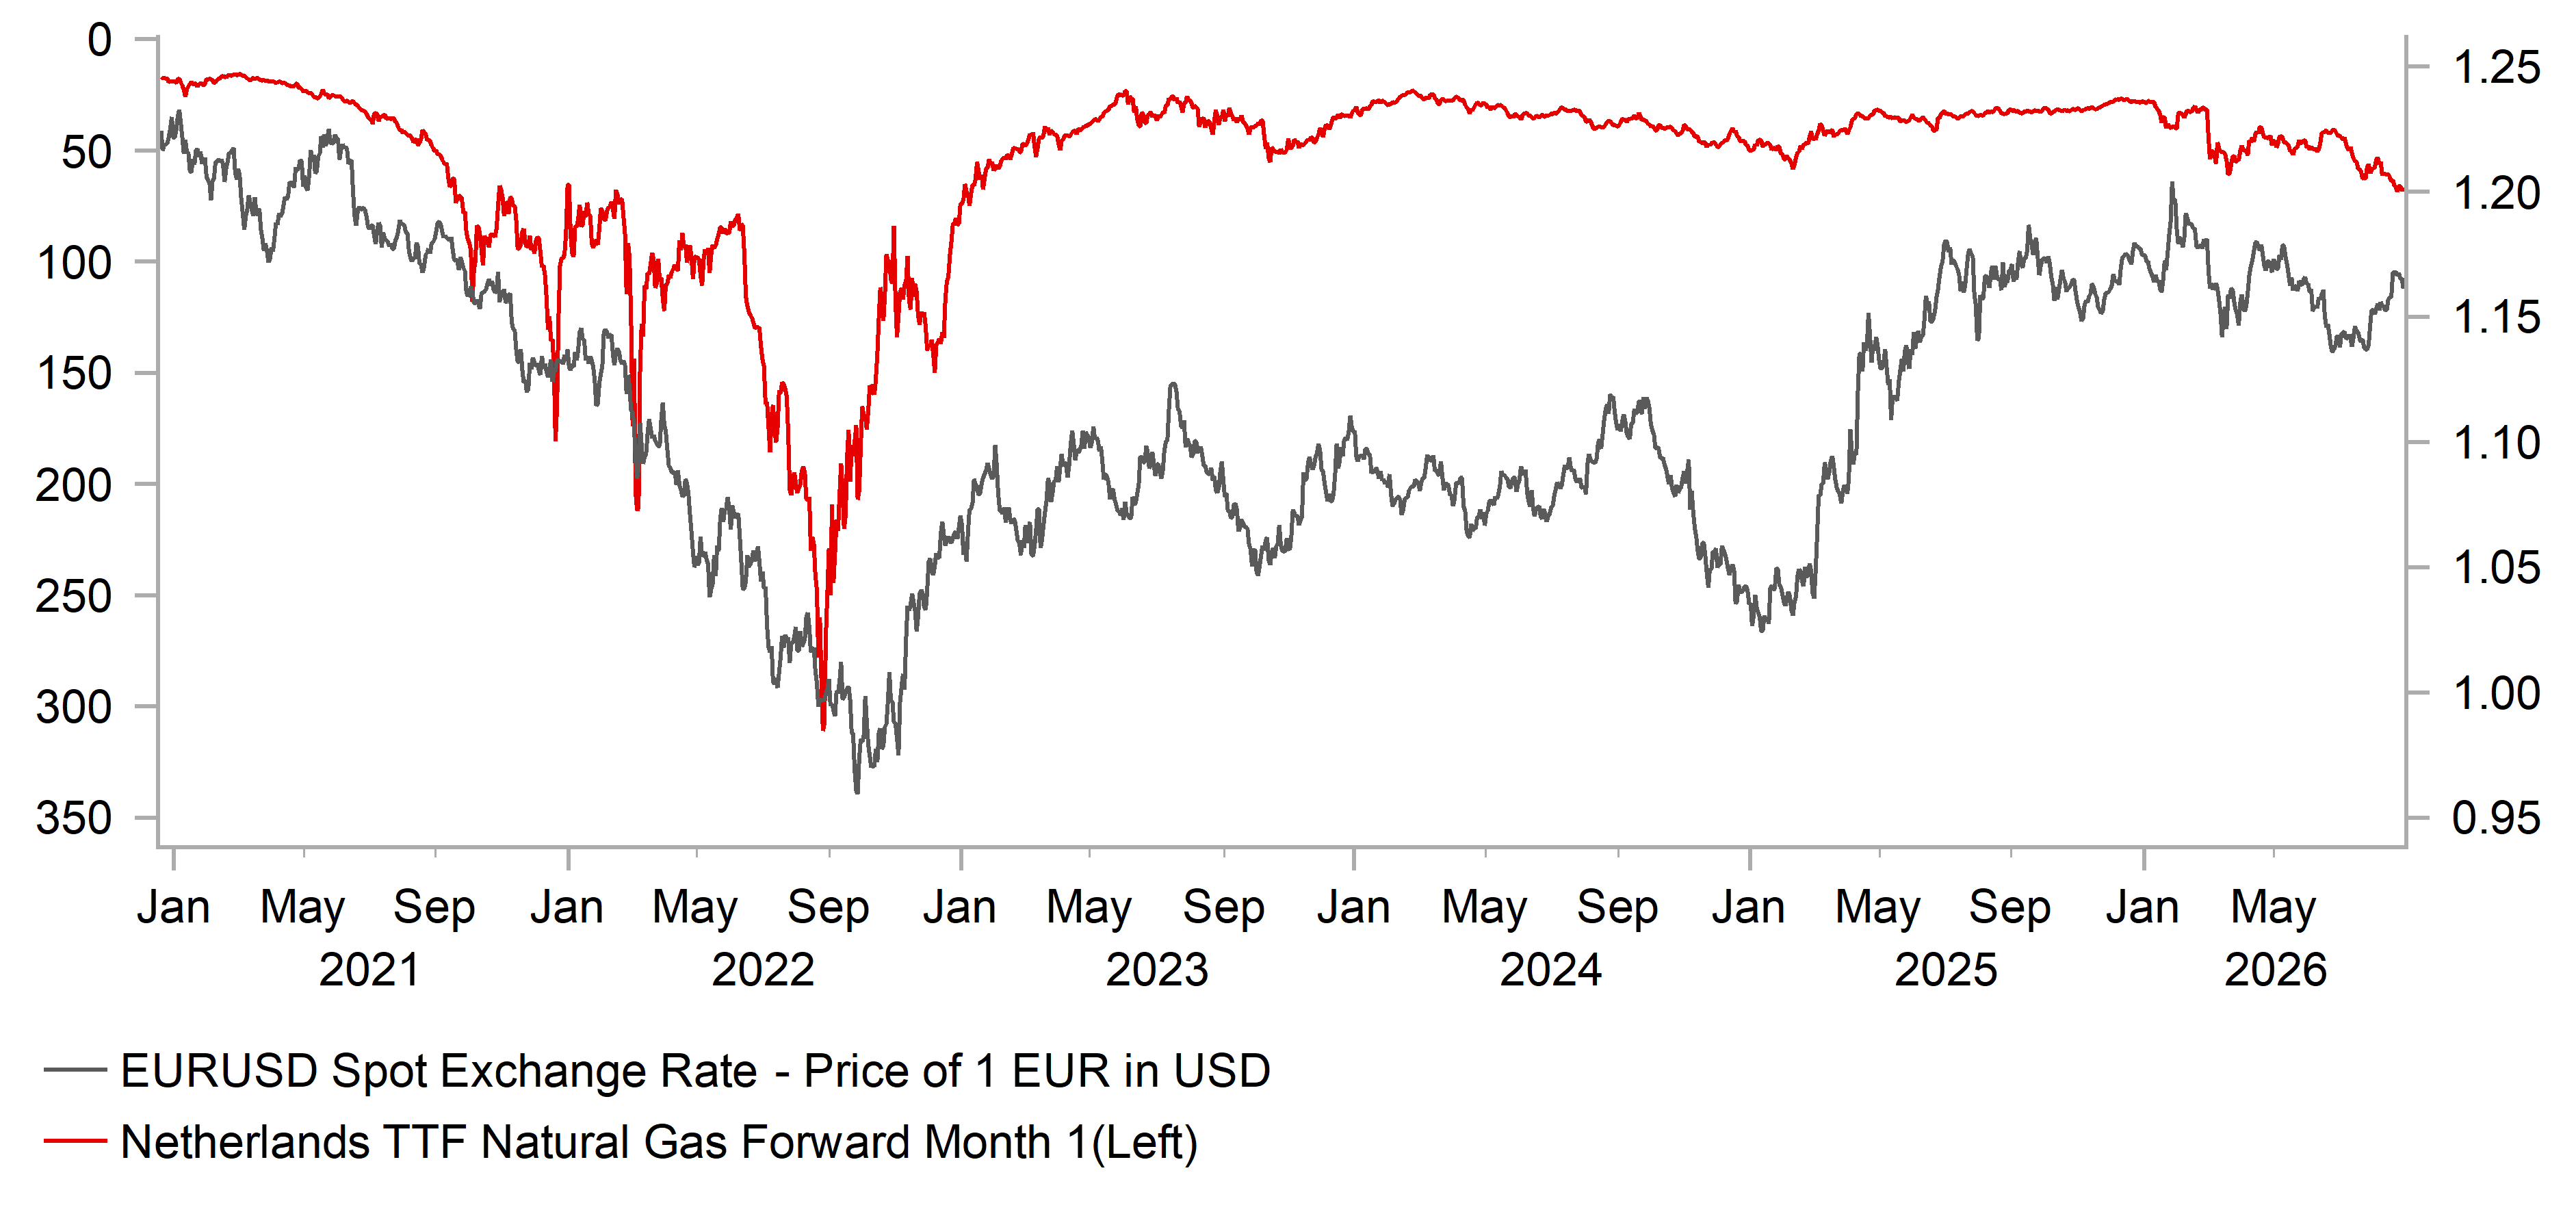
The US dollar was generally weaker again in August and EUR/USD gained further on the back of renewed focus on US dollar debasement fears. The euro as the most liquid alternative to the dollar benefits by default. However, the euro was the fourth best performing G10 currency in August and advanced on a trade-weighted basis as well, by 0.7%. The ECB’s EUR EER reached the highest level since May. What became more apparent in August was the improvement in sentiment despite the continued risks related to the Middle East and energy prices. The German IFO Business Climate Index jumped more than expected (86.7 to 88.8) – the index has more than fully retraced the drop after the conflict began and reached a level not seen since August last year. Natural gas prices need monitoring given the risk of gains hitting growth and confidence but more tanker traffic through the Strait of Hormuz is helping contain prices for now. However, TTF natural gas gained 20% in August after a 33% gain in July. German grid operators stated in August that the winter gas storage target was “virtually unattainable”. Storage as of 24th August was 63% of capacity vs a 5yr average of 81%. The improvement in the economic outlook while inflation risks persist was enough for ECB Executive Board member Schnabel to state that “further tightening will be necessary”. The OIS market is now nearly fully priced for a September hike and 80% priced for two 25bp hikes by year-end. We expect one but increasingly see the risk of the ECB delivering another.
Political uncertainty in Europe will remain elevated over the coming year, notably ahead of German state elections in September and the French presidential election in April 2027. While strong performances by anti-establishment parties could generate bouts of volatility and renewed scrutiny of fiscal policy, recent experience suggests that lasting FX effects require a meaningful change in the policy outlook. For now, we see limited evidence that upcoming elections will materially alter the euro area's macro outlook. The AfD could win strongly in the Saxony-Anhalt state election on 6th September, which would further undermine the Merz government.
Consequently, while political developments warrant close monitoring, we continue to believe that EUR direction will be determined primarily by relative growth and interest rate expectations rather than electoral outcomes. Recent signs of economic resilience and the continued willingness of the ECB to respond to upside inflation risks will continue to provide support for EUR/USD.
INTEREST RATE OUTLOOK
Interest Rate Close | Q3 2026 | Q4 2026 | Q1 2027 | Q2 2027 | |
Policy Rate | 2.25% | 2.50% | 2.50% | 2.50% | 2.50% |
3-Month Bill | 2.50% | 2.60% | 2.55% | 2.50% | 2.50% |
10-Year Yield | 3.32% | 3.30% | 3.20% | 3.10% | 3.00% |
* Interest rate assumptions incorporated into MUFG foreign exchange forecasts.
The 10-year German bund yield jumped again in August but by a more modest 11bps to close at 3.32%. The backdrop in the euro-zone remains supportive for yields with some of the key sentiment data highlighting resilient corporate sentiment in the face of elevated uncertainties. Companies initially fearful of a repeat of the energy price shock in 2022-23 now see more moderate energy price moves. That said, while crude oil prices are contained there have been notable increases in natural gas prices (over 70% from late June through Aug) and that move will likely keep the ECB concerned over upside inflation risks. We have maintained our view that the ECB will hike in September and then be in a position to pause. The obvious risk here is that the ECB needs to hike further. Executive Board member Schnabel, in Jakson Hole, was clear in her message of upside inflation risks. However, our core view remains that the Middle East conflict will not result in a problematic further jump in energy prices. A deal is done or enough tanker traffic gets through the Strait of Hormuz to lower energy prices. Hence at these levels of yield we see greater scope for some moderate retracement lower.
ECB DAILY NOMINAL EER
Source: : Bloomberg, Macrobond & MUFG GMR
EUR/USD VS. TTF NATURAL GAS
Source:: Bloomberg, Macrobond & MUFG GMR
Pound Sterling
Spot close 28.08.26 | Q3 2026 | Q4 2026 | Q1 2027 | Q2 2027 | |
EUR/GBP | 0.8556 | 0.8550 | 0.8650 | 0.8700 | 0.8750 |
GBP/USD | 1.3556 | 1.3450 | 1.3640 | 1.3790 | 1.3710 |
GBP/JPY | 216.94 | 212.50 | 212.80 | 212.40 | 208.50 |
Consensus | Consensus | Consensus | Consensus | ||
GBP/USD | 1.3400 | 1.3400 | 1.3500 | 1.3500 |
MARKET UPDATE
In August the pound strengthened versus the dollar in terms of London closing rates, moving from 1.3465 to 1.3556. However, the pound weakened marginally against the euro from 0.8547 to 0.8556. The MPC did not meet in August and hence the key policy rate was unchanged at 3.75%, after six 25bp cuts since August 2024.
OUTLOOK
The pound strengthened versus US dollar and the euro, and the BoE TWI gained an additional 0.5% after a 0.8% gain in July. The pound remains the second best performing G10 currency since the Middle East conflict began at the end of February. The UK economy continues to hold up better than expected and this economic resilience is not feeding into higher domestically generated inflation concerns at this juncture. Real GDP in Q2 expanded by 0.4% Q/Q following a 0.6% expansion in Q1 – the strongest performance since the first half of 2024. Momentum going into Q3 was also solid with the MoM increase in June a strong 0.3%. That gain was driven by a 0.4% gain in services. Services looks to have remained resilient in Q3 with the PMI services index in August increasing to 52.8, the strongest level since February.
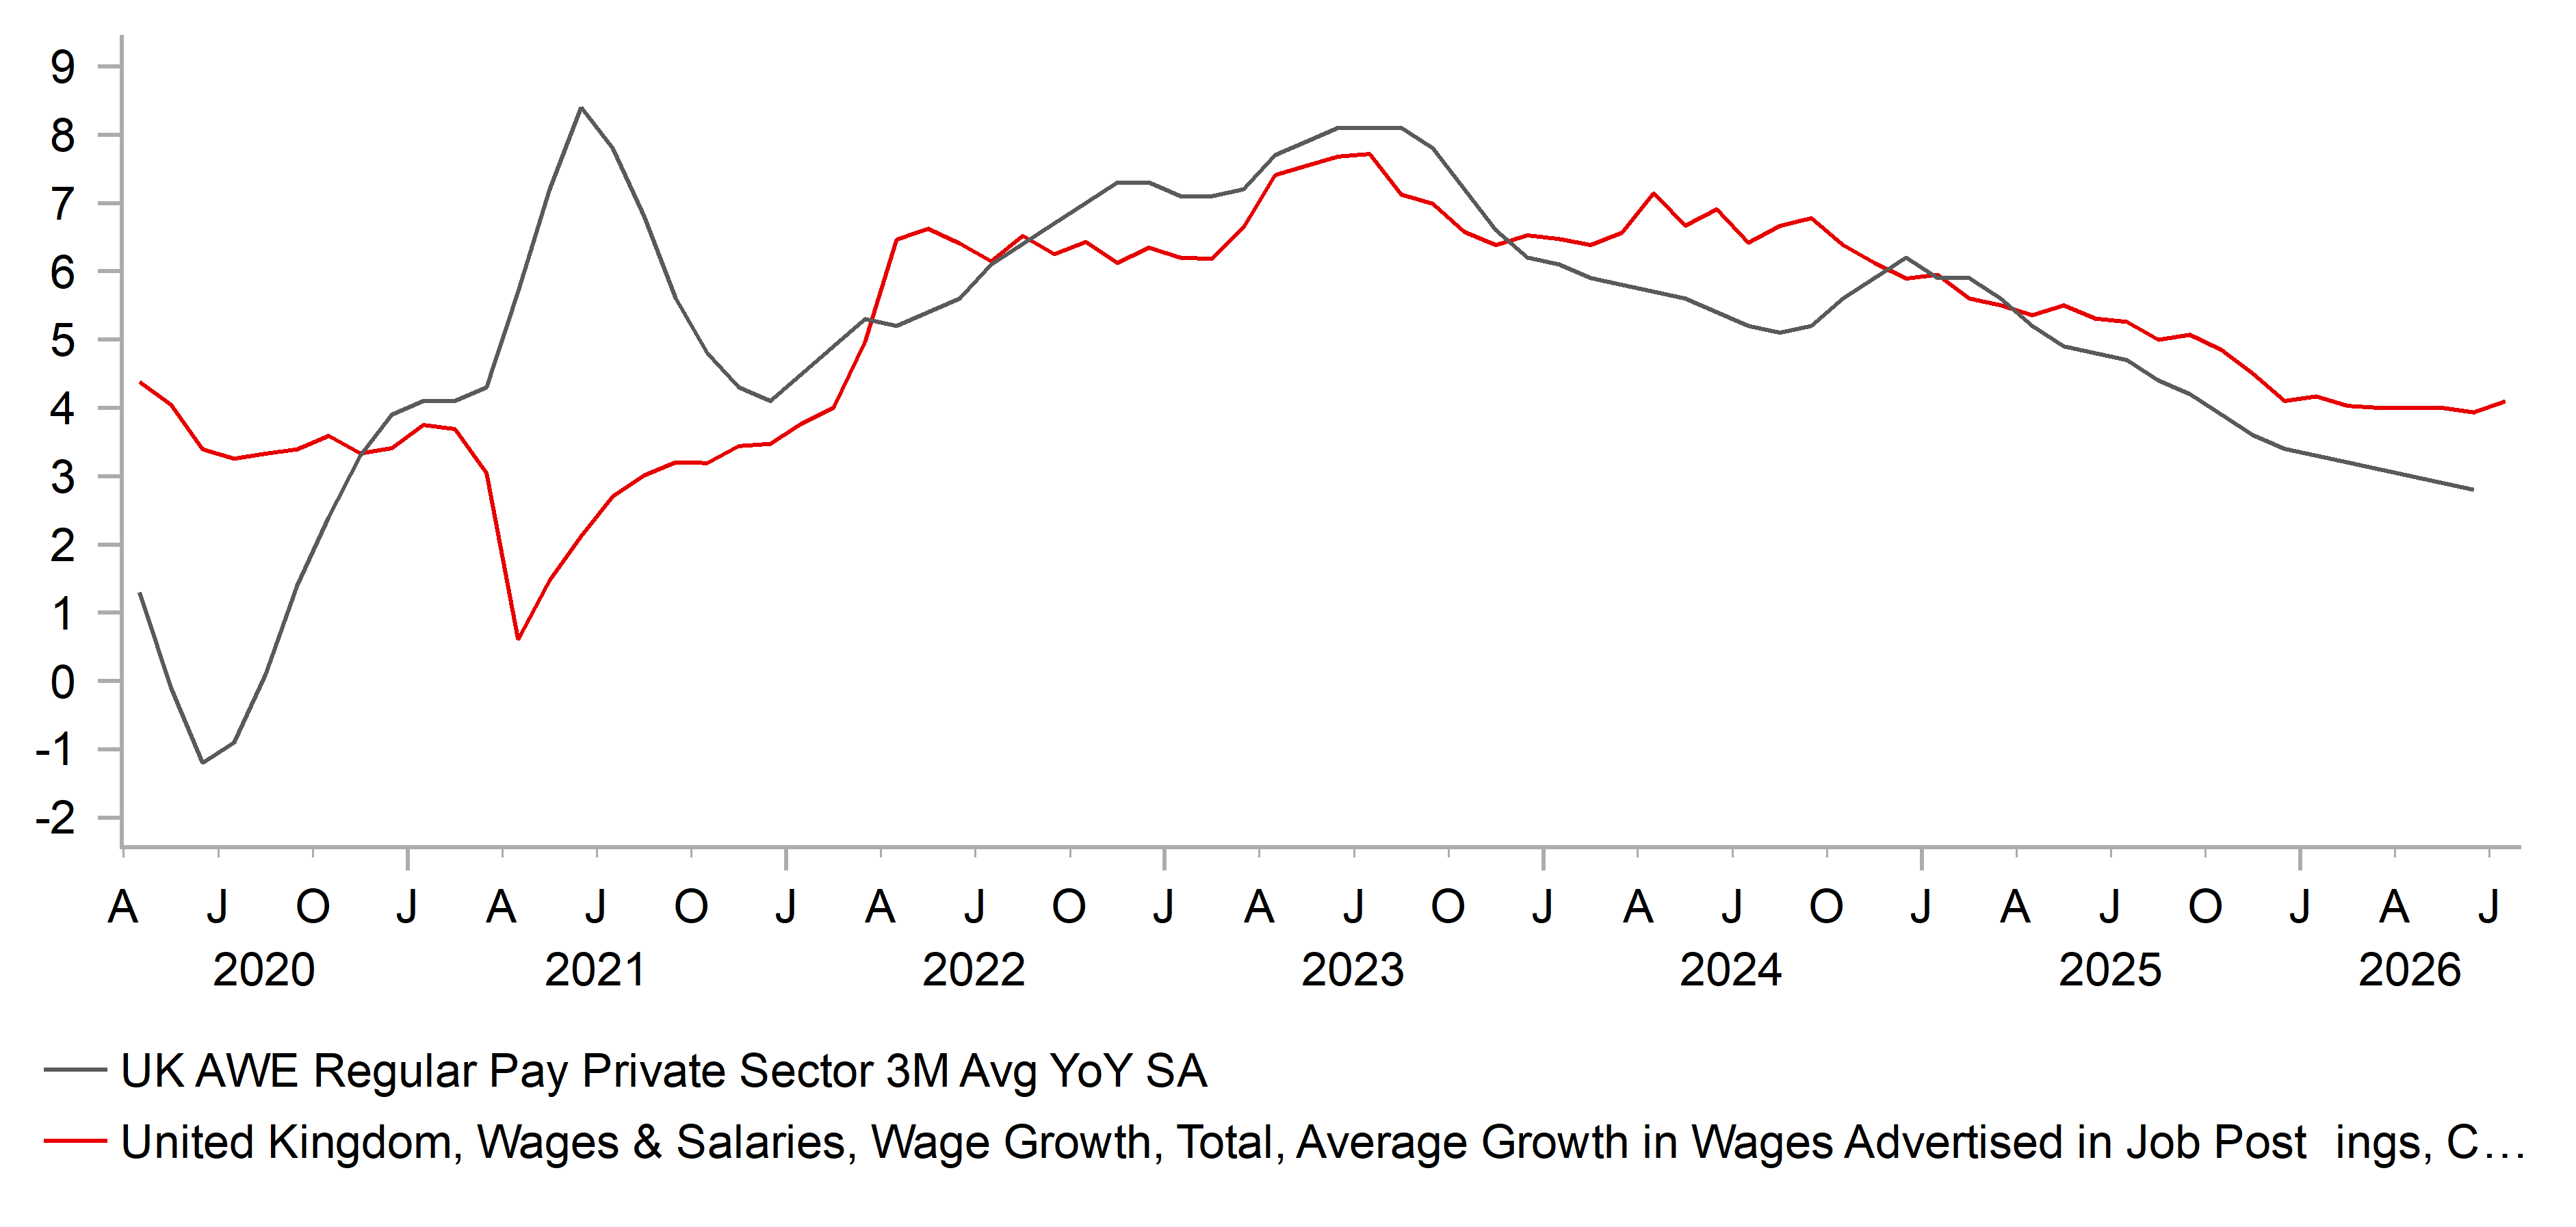
The resilience is not translating to increased investor concerns over inflation. YoY CPI in July increased as expected due to the OFGEM utility bill price cap but there were no underlying upside surprises and the evidence of domestically generated inflationary pressures remain sparse. OFGEM confirmed a 4% further increase effective October, which was very close to the BoE estimate assumed in its inflation projections published in July. PAYE employment fell 13k in July and underlying private sector wage growth (3mth YoY) slowed to 2.8% in June – excluding the covid period, that increase was the weakest since June 2018 and the 16th consecutive month of slowing annual growth. That is compelling reason to hold off hiking if the external inflation risks subside. The external risks remain of course but crude oil prices gained only 0.4% in August indicating scope for the BoE to stay on hold. The BoE remaining on hold this year will likely see a notable decline in front-end yields.
The 12mth OIS implied 70bps of tightening and would leave the UK with the highest official policy rate in G10. We suspect this pricing is excessive and will adjust lower as domestically generated inflation remains subdued and energy risks subside. PM Burnham’s honeymoon period looks to be coming to an end and the fiscal constraints on adopting any meaningful policy initiatives to support economic growth could raise fears of steps that lack fiscal credibility.
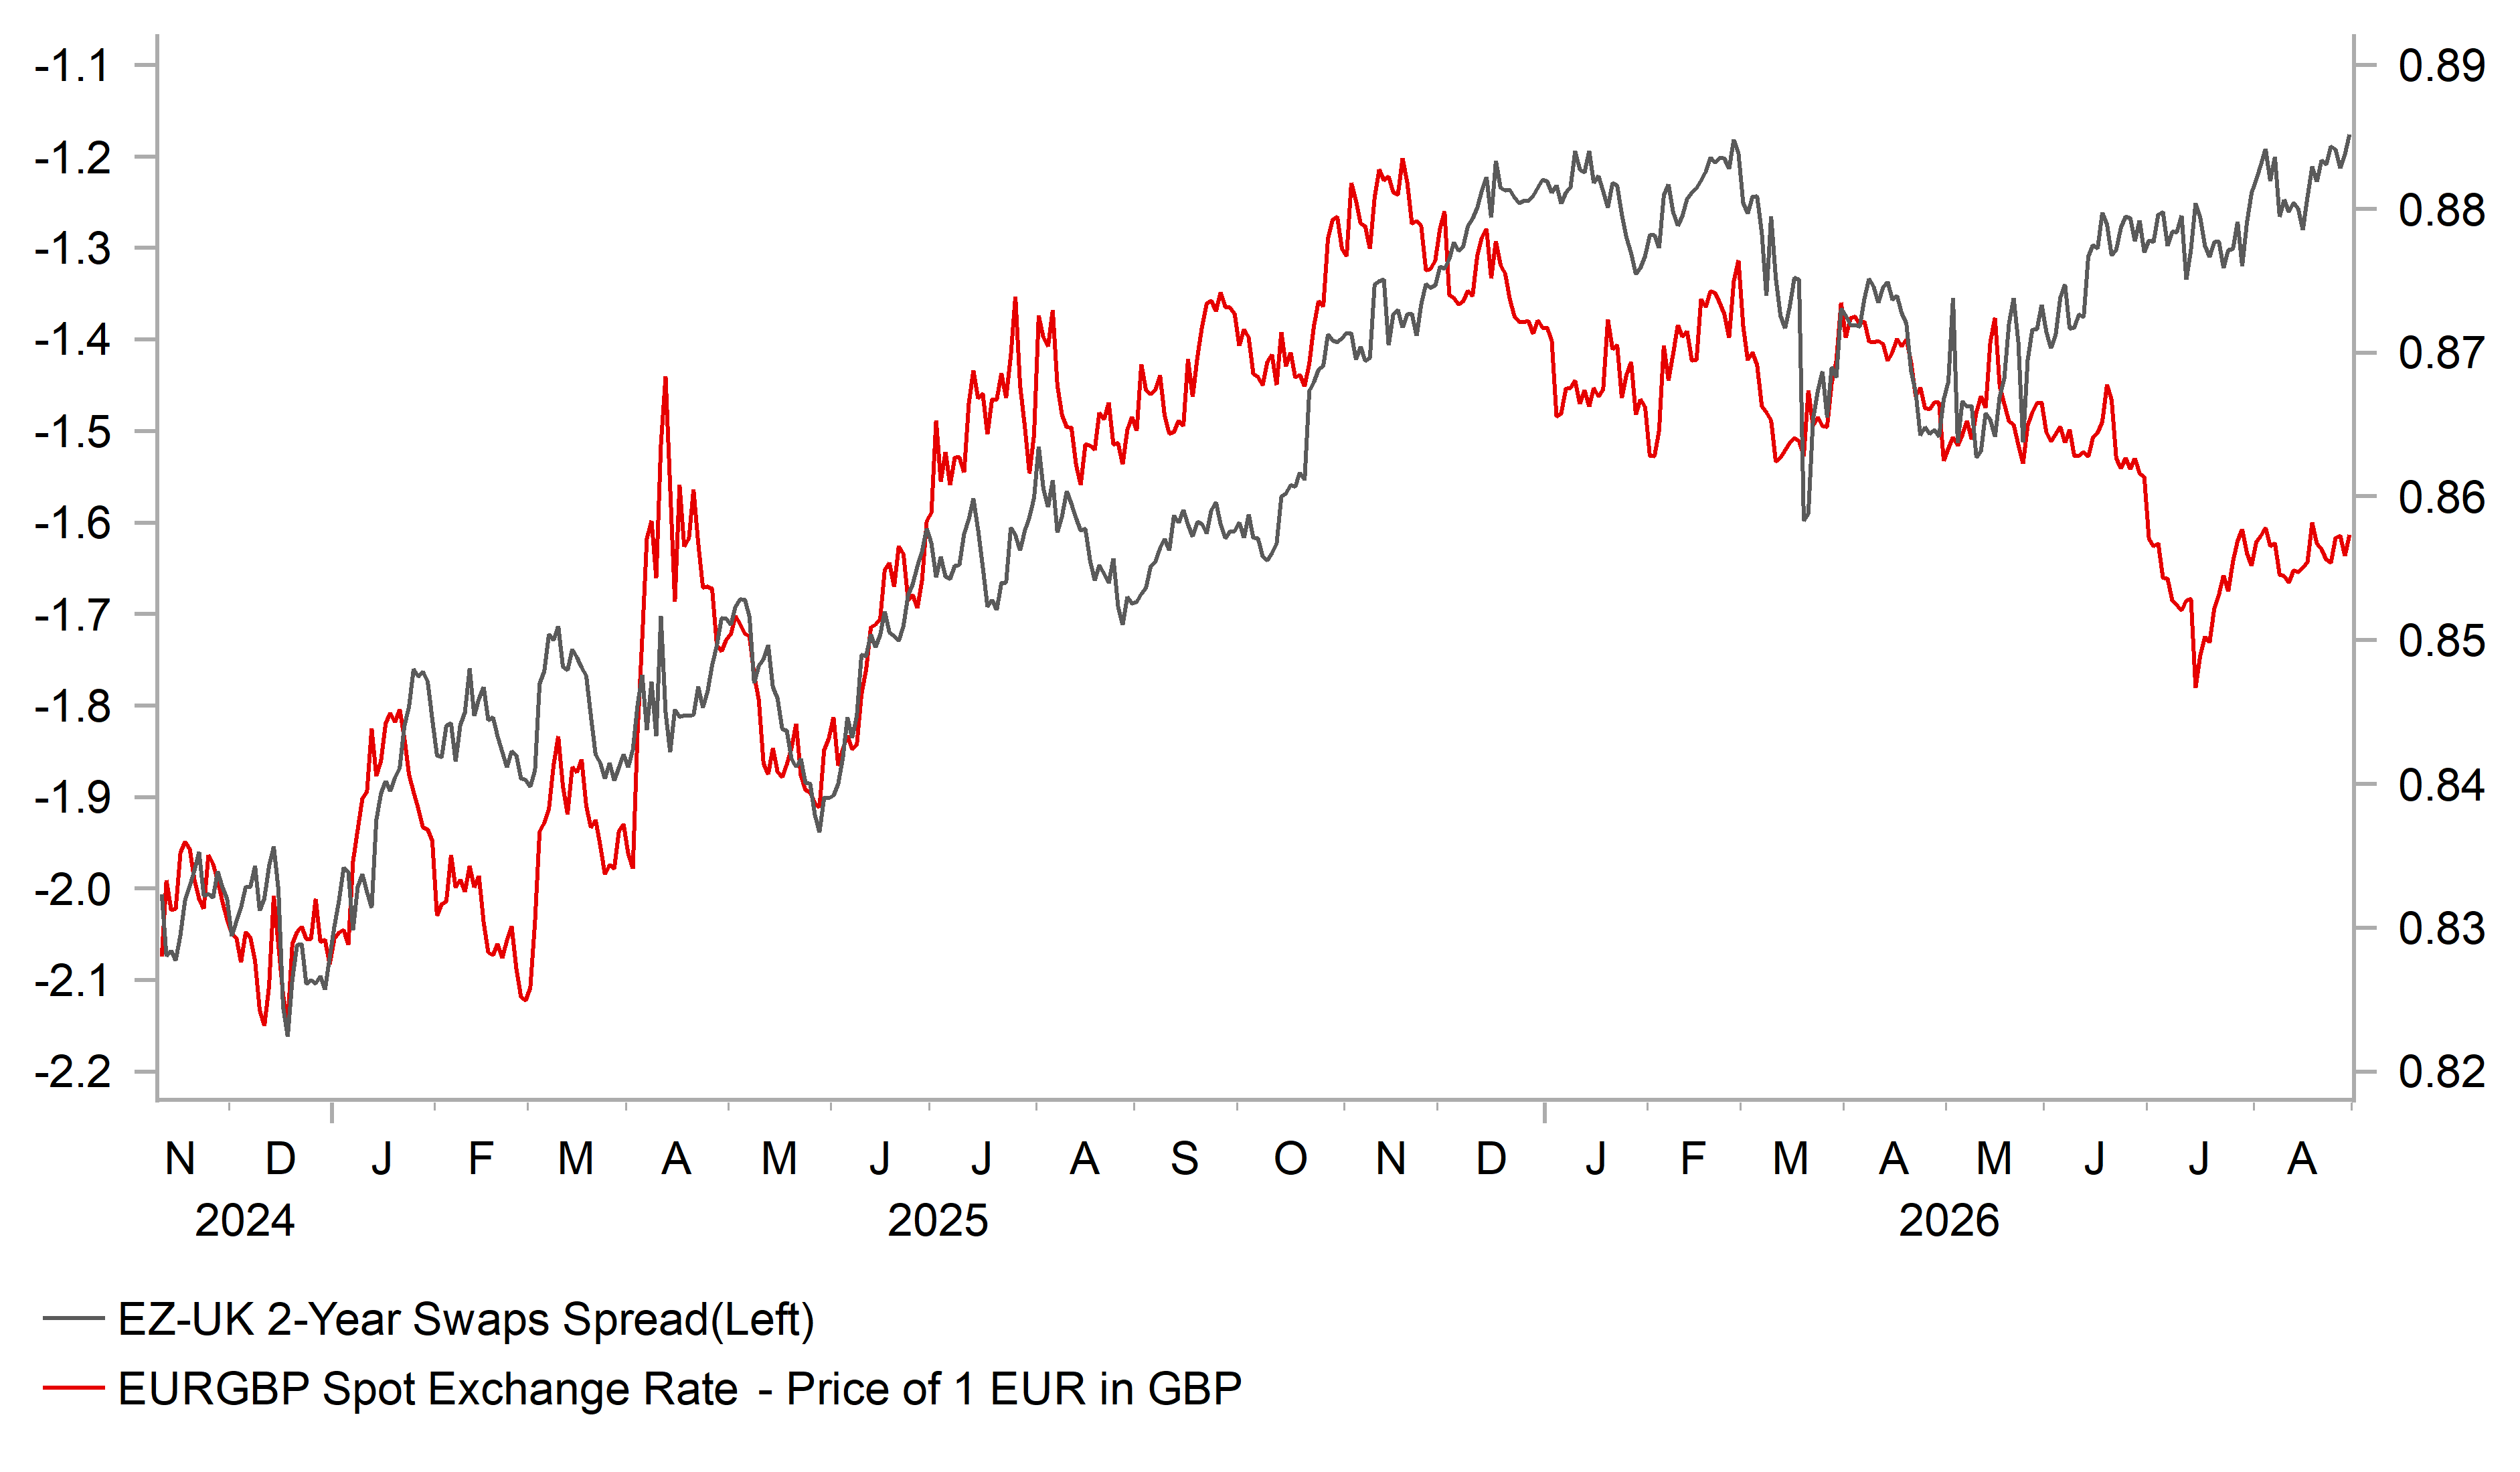
The pound continues to outperform relative yield changes and based on EZ-UK 2yr spreads, EUR/GBP should be trading between 0.8800-0.8900. Better economic growth and weaker inflation has helped improve investor confidence. Still, with GBP/USD already at our 12mth forecast (1.3640) we have adjusted our GBP forecasts slightly stronger but still assume some correction weaker initially
INTEREST RATE OUTLOOK
Interest Rate Close | Q3 2026 | Q4 2026 | Q1 2027 | Q2 2027 | |
Policy Rate | 3.75% | 3.75% | 3.75% | 3.50% | 3.50% |
3-Month Bill | 3.91% | 3.85% | 3.75% | 3.40% | 3.40% |
10-Year Yield | 5.06% | 5.10% | 4.90% | 4.70% | 4.60% |
* Interest rate assumptions incorporated into MUFG foreign exchange forecasts.
The 10-year Gilt yield declined modestly in August, by 1bps to close at 5.06%. Since the surge in long-term yields after the start of the Middle East conflict, the 10-year Gilt yield has traded most of the time between 4.80%-5.20% reflecting, in part anyway, the increased inflation risks. The 5y5y inflation swap and the 10-year breakeven rate show strong correlations with crude oil prices. We assume a resolution is found that helps keep energy prices in check and ultimately allow for oil and natural gas prices to retrace. That will be key for lower 10-year Gilt yields. The data of late is certainly reinforcing the prospects of lower risks of domestically generated inflation that will ultimately open up scope for the BoE to ease the monetary stance in Q1 2027. With private sector wage growth at its weakest since June 2018, the inflation outlook is improving. The period 2018-19 saw headline inflation average 2.2%. We also see UST bond yields declining in the US as well which will be a key driver of direction for Gilt yields. An escalation of the conflict and jump in inflation is an obvious risk to our view.
EZ-UK 2YR SWAPS VS. EUR/GBP
Source: : Bloomberg, Macrobond & MUFG GMR
UK PRIVATE SECTOR PAY YOY, % VS. UK INDEED WAGE YOY, %
Source: : Bloomberg, Macrobond & MUFG GMR
Chinese renminbi
Spot close 28.08.26 | Q3 2026 | Q4 2026 | Q1 2027 | Q2 2027 | |
USD/CNY | 6.7272 | 6.7000 | 6.6500 | 6.6000 | 6.6000 |
USD/HKD | 7.8403 | 7.8300 | 7.8300 | 7.8300 | 7.8300 |
Consensus | Consensus | Consensus | Consensus | ||
USD/CNY | 6.7500 | 6.7000 | 6.6500 | 6.6300 | |
USD/HKD | 7.8300 | 7.8200 | 7.8200 | 7.8200 |
MARKET UPDATE
In August, USD/CNY fell from 6.7524 to 6.7272. On 20th August, the PBoC kept the 1Y and 5Y LPR steady at 3.00% and 3.50% respectively. The Q2 PBoC Monetary Policy Implementation Report released in mid-August provided little new policy guidance, largely echoing the July Politburo meeting's call to "comprehensively utilize and timely adjust monetary policy tools" without further details.
OUTLOOK
The Chinese economy continued to lose some steam in its growth momentum in July following a below-target Q2 GDP growth, as the strength in exports/high-tech industries and somewhat accelerated government bond issuance failed to offset the broader weakness in domestic demand. Nearly all major activity indicators for July including IP surprised to the downside although extreme weather was partly to blame. The softer print in core CPI inflation since May is also concerning. Overall, the “K-shape” dynamics are likely to persist through the rest of this year, though we expect a faster pace of government bond issuance to boost infrastructure investment particularly in “six networks” related projects to stabilize growth. Remaining 44% of annual bond quota or RMB 6.1tn of funds are to be deployed for August-December period. While the main policy focus remains on expediting the rollout of existing policy measures, the authorities have signaled their willingness to step up the support if needed. The MoF announced the plan to unveil additional fiscal-financial coordination policy measures in 2H and will consider incremental policy measures depending on economic condition. At the same time, they also introduced optimization of the fiscal-financial coordination policy to support domestic demand, benefiting both small private businesses and consumers through broader scope of loan/ credit card installments subsidy eligibility and higher subsidy caps.
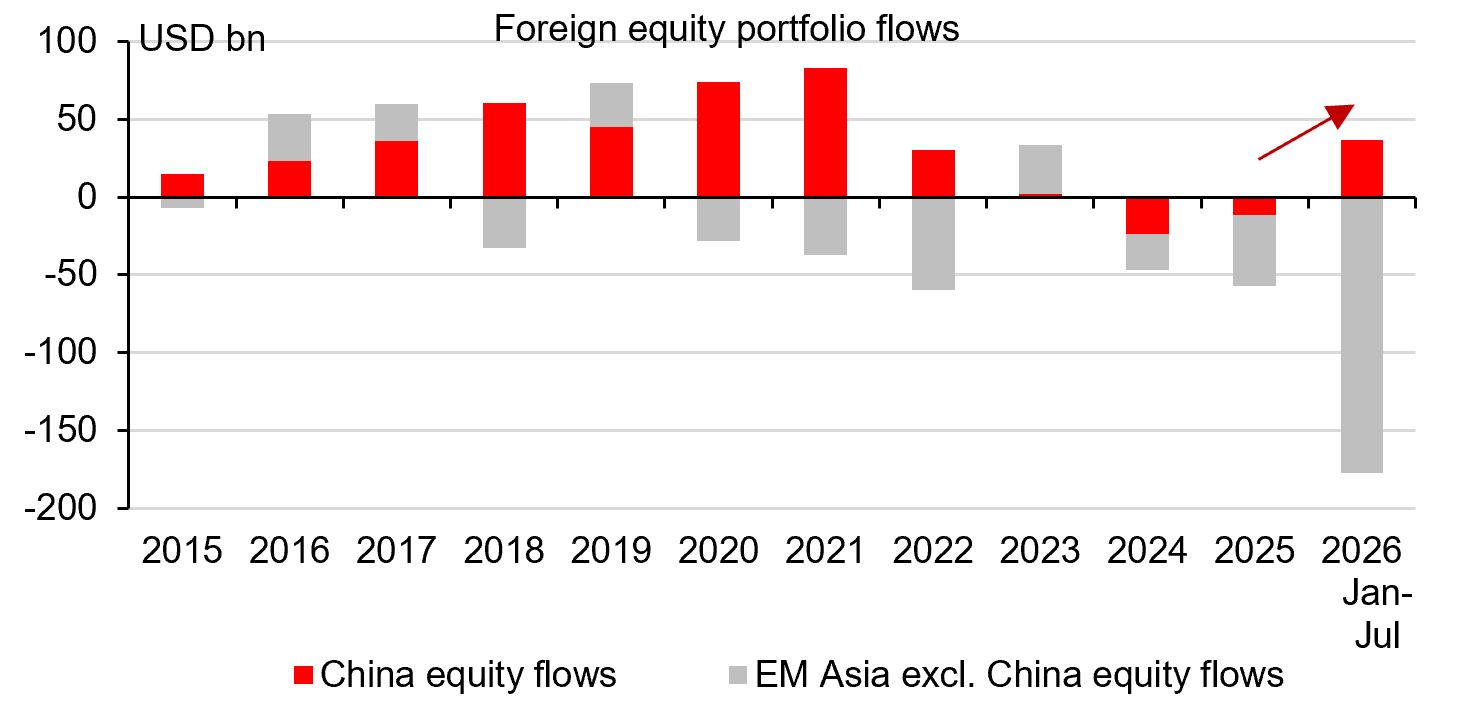
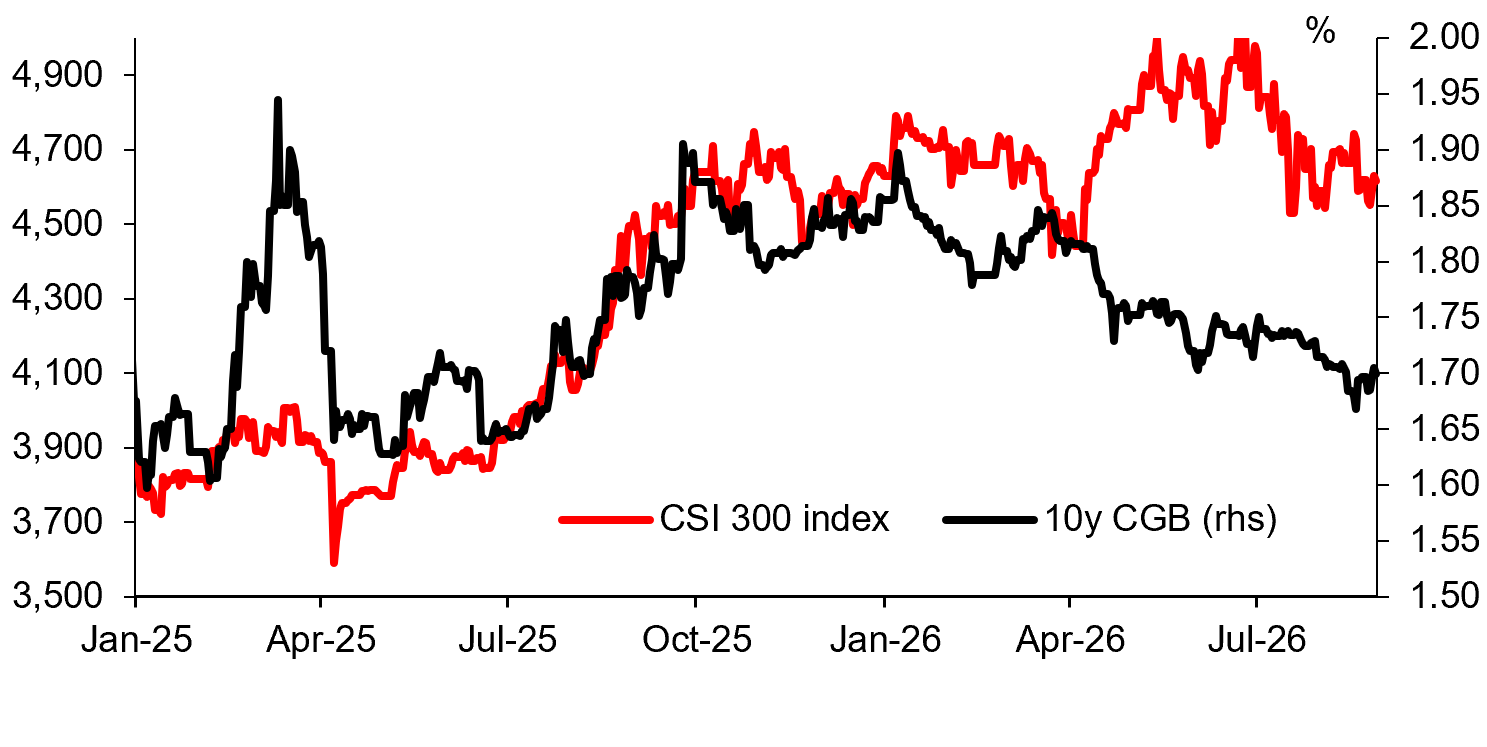
The weakness in the July macro data did not deter CNY from further appreciating albeit modestly in August, helped by the weaker dollar backdrop and strong exports/ trade balance. That said, CSI 300 performance was rather range bound as tech sentiment recovery was offset by weaker prospect of China’s economy. As such, a solid domestic demand/ earnings recovery will be helpful to further attract foreign equity inflow in addition to the structural theme around China’s AI tech. While China suffered some foreign equity outflow in June-July period (net USD 18bn) given the global tech volatility, the IIF data showed a total USD 37bn net foreign inflow into China’s equity during first 7-months this year (whereas the rest of EM Asia on aggregate suffered net outflow). The CNY could strengthen modestly in September as China's trade surplus remains sizeable and export performance continues to provide a steady source of FX inflows. In addition, any moderation in US dollar strength or Treasury yields would help narrow external pressures on the renminbi, allowing for gradual appreciation while policymakers maintain overall currency stability.
INTEREST RATE OUTLOOK
Interest Rate Close | Q3 2026 | Q4 2026 | Q1 2027 | Q2 2027 | |
LPR 1Y | 3.00% | 3.00% | 3.00% | 3.00% | 3.00% |
7-Day Reverse Repo Rate | 1.40% | 1.40% | 1.40% | 1.40% | 1.40% |
10-Year Yield | 1.70% | 1.75% | 1.80% | 1.85% | 1.85% |
* Interest rate assumptions incorporated into MUFG foreign exchange forecasts.
In August, the 10-year CGB yield fell below 1.70%, briefly touching 1.67%, driven by a liquidity boost from the PBOC's first-ever mid-month overnight reverse repo operation. Looking ahead, with the Ministry of Finance preparing additional fiscal-financial coordination measures, the PBOC could further strengthen policy support through structural tools such as relending rate cuts and expanded relending quotas to support strategic sectors. Previous policy measures lowered funding costs for both corporates and banks in priority sectors including technology, manufacturing and services. The key question now is whether policymakers will introduce more direct support for household consumption, which remains the economy's weakest link. For now, we continue to expect no cut to the policy rate. In rest of the year, government bond issuance is likely to accelerate, which, together with a modest stabilisation in domestic demand and improving business confidence, should put gradual upward pressure on 10-year CGB yields from current depressed levels. However, subdued household loan growth and ample system liquidity are likely to sustain banks' demand for government bonds, limiting the extent of any yield increase.
FOREIGN SENTIMENT TOWARDS CHINESE EQUITY HAS TURNED POSITIVE
Source: IIF, MUFG GMR
SLOWER PACE OF GOVERNMENT BOND ISSUANCE IN 2Q VS 1Q THIS YEAR
Source: Bloomberg, MUFG GMR