Please download PDF from above for the following currencies.
Australian dollar // New Zealand dollar //Canadian dollar // Norwegian krone // Swedish Krona // Swiss franc // Czech koruna // Hungarian forint //Polish zloty // Romanian leu // Russian rouble // South African rand // Turkish lira // Indian rupee // Indonesian rupiah // Malaysian ringgit // Philippine peso //Singapore dollar // South Korean won // Taiwan dollar // Thai baht // Vietnamese dong // Argentine peso // Brazilian real // Chilean peso // Mexican peso // Crude oil // Saudi riyal // Egyptian pound
Monthly Foreign Exchange Outlook
DEREK HALPENNY
Head of Research, Global Markets EMEA and International Securities
Global Markets Research
Global Markets Division for EMEA
E: derek.halpenny@uk.mufg.jp
LEE HARDMAN
Senior Currency Analyst
Global Markets Research
Global Markets Division for EMEA
E: lee.hardman@uk.mufg.jp
LIN LI
Head of Global Markets Research Asia
Global Markets Research
Global Markets Division for Asia
E: lin_li@hk.mufg.jp
KHANG SEK LEE
Associate
Global Markets Research
Global Markets Division for Asia
E: khangsek_lee@hk.mufg.jp
MICHAEL WAN
Senior Currency Analyst
Global Markets Research
Global Markets Division for Asia
E: michael_wan@sg.mufg.jp
LLOYD CHAN
Senior Currency Analyst
Global Markets Research
Global Markets Division for Asia
E: lloyd_chan@sg.mufg.jp
EHSAN KHOMAN
Head of Commodities, ESG and Emerging Markets Research – EMEA
DIFC Branch – Dubai
E: ehsan.khoman@ae.mufg.jp
SOOJIN KIM
Analyst, ESG and Emerging Markets Research – EMEA
DIFC Branch – Dubai
E: soojin.kim@ae.mufg.jp
MUFG Bank, Ltd.
A member of MUFG, a global financial group
May 2025
KEY EVENTS IN THE MONTH AHEAD
1) TRACKING TRUMP ACTIONS
The US dollar fell sharply again in April and over March and April, the dollar (DXY basis) is down by -7.6%. The scale of the move in large part reflects a decline in investor confidence in US assets reflecting the uncertainty of economic policy given the scale of the reciprocal tariffs announced on 2nd April was way above worst-case scenario estimates. There are no specific dates for scheduled further action in May apart from the previously announced 25% tariff on auto-parts, which will go live on 3rd May. Some goods imported from China to the US now face a tariff rate of 245% - 125% reciprocal tariff; 20% fentanyl crisis tariff; and Section 301 tariffs that range from 7.5% to 100%. The financial markets will be monitoring closely for comments suggesting this bilateral trade relationship status could de-escalate. In addition, investors await the outcome of Section 232 investigations into the impact on national security from pharmaceuticals and semi-conductors. While in theory these can take as long as 270 days, the White House will move much faster. Finally, the FOMC policy announcement and press conference will be on 7th May and this is an obvious potential flash point for a further escalation in tensions between Fed Chair Powell and President Trump. The FOMC is highly likely to keep the fed funds rate unchanged which will likely prompt renewed complaint from President Trump. Fed Chair Powell is in a difficult position and could be reluctant even to offer guidance on a rate cut given the elevated level of uncertainty.
2) OTHER CENTRAL BANK MEETINGS
The BoJ met at the very start of May and as expected left its key policy rate unchanged and was cautious in providing guidance on future policy steps. The Norges Bank, Riksbank and BoE all meet on 8th May. The BoE is most likely to move with a 25bp cut fully priced in. Market pricing implies little prospect for a cut from Norges Bank or the Riksbank. The Norges Bank should cut for the first time in June. The RBA meets on 20th May and the RBNZ on 28th May. Both central banks are expected to cut by 25bps. We would expect a similar theme in terms of guidance by central banks in May – providing little in the way of clear guidance given the degree of uncertainty related to US trade policy.
3) TARIFFS DEVELOPMENT MATTERS FOR THE PACE AND MAGNITUDE OF CHINA POLICY STIMULUS
The upcoming China April macro data will provide more visible evidence of the negative impact of US tariffs on the economy. However, we expect significant fiscal stimulus to be rolled out by the Chinese government only after more clarity on tariffs. The key driving events for USD/CNY likely still are tariff developments and the pace of implementation for China’s already announced policies and moderate incremental stimulus.
Forecast rates against the US dollar - End-Q2 2025 to End-Q1 2026
|
Spot close 30.04.25 |
Q2 2025 |
Q3 2025 |
Q4 2025 |
Q1 2026 |
|
|
JPY |
142.85 |
144.00 |
142.00 |
140.00 |
138.00 |
|
EUR |
1.1325 |
1.1200 |
1.1500 |
1.1800 |
1.2000 |
|
GBP |
1.3330 |
1.3180 |
1.3370 |
1.3640 |
1.3790 |
|
CNY |
7.2698 |
7.4000 |
7.4500 |
7.4000 |
7.3500 |
|
AUD |
0.6395 |
0.6200 |
0.6300 |
0.6500 |
0.6600 |
|
NZD |
0.5928 |
0.5800 |
0.5900 |
0.6000 |
0.6200 |
|
CAD |
1.3820 |
1.4000 |
1.3800 |
1.3600 |
1.3500 |
|
NOK |
10.394 |
10.536 |
10.435 |
10.000 |
9.583 |
|
SEK |
9.6830 |
9.9110 |
9.7390 |
9.3220 |
8.9170 |
|
CHF |
0.8237 |
0.8300 |
0.8170 |
0.8050 |
0.7920 |
|
|
|
|
|
|
|
|
CZK |
22.017 |
22.230 |
21.570 |
20.930 |
20.500 |
|
HUF |
356.76 |
361.60 |
356.50 |
351.70 |
345.80 |
|
PLN |
3.7775 |
3.7950 |
3.6960 |
3.6440 |
3.5830 |
|
RON |
4.3937 |
4.4460 |
4.3390 |
4.2460 |
4.1920 |
|
RUB |
81.393 |
81.590 |
78.690 |
79.560 |
82.570 |
|
ZAR |
18.621 |
18.750 |
19.250 |
19.000 |
18.750 |
|
TRY |
38.474 |
40.000 |
41.500 |
44.000 |
46.000 |
|
|
|
|
|
|
|
|
INR |
84.483 |
85.000 |
84.500 |
84.000 |
83.500 |
|
IDR |
16598 |
16625 |
16410 |
16200 |
16100 |
|
MYR |
4.3130 |
4.3900 |
4.4100 |
4.4500 |
4.3100 |
|
PHP |
55.841 |
56.300 |
55.600 |
55.000 |
54.500 |
|
SGD |
1.3071 |
1.3300 |
1.3400 |
1.3500 |
1.3100 |
|
KRW |
1426.2 |
1445.0 |
1455.0 |
1445.0 |
1435.0 |
|
TWD |
31.961 |
32.600 |
32.800 |
32.600 |
32.500 |
|
THB |
33.370 |
34.000 |
34.100 |
34.400 |
33.400 |
|
VND |
25914 |
26200 |
26300 |
26400 |
26400 |
|
|
|
|
|
|
|
|
ARS |
1167.9 |
1225.0 |
1275.0 |
1325.0 |
1400.0 |
|
BRL |
5.6552 |
5.7000 |
5.8000 |
5.9000 |
5.8000 |
|
CLP |
955.17 |
960.00 |
980.00 |
990.00 |
980.00 |
|
MXN |
19.599 |
20.000 |
19.750 |
19.500 |
19.000 |
|
|
|||||
|
Brent |
63.48 |
65.00 |
63.00 |
62.00 |
64.00 |
|
NYMEX |
59.93 |
60.00 |
58.00 |
57.00 |
59.00 |
|
SAR |
3.7508 |
3.7500 |
3.7500 |
3.7500 |
3.7500 |
|
EGP |
50.750 |
50.800 |
51.000 |
51.200 |
51.400 |
Notes: All FX rates are expressed as units of currency per US dollar bar EUR, GBP, AUD and NZD which are expressed as dollars per unit of currency. Data source spot close; Bloomberg closing rate as of 4:30pm London time, except VND which is local onshore closing rate.
US dollar
|
Spot close 30.04.25 |
Q2 2025 |
Q3 2025 |
Q4 2025 |
Q1 2026 |
|
|
USD/JPY |
142.85 |
144.00 |
142.00 |
140.00 |
138.00 |
|
EUR/USD |
1.1325 |
1.1200 |
1.1500 |
1.1800 |
1.2000 |
|
Range |
Range |
Range |
Range |
||
|
USD/JPY |
135.00-150.00 |
133.00-148.00 |
131.00-146.00 |
129.00-144.00 |
|
|
EUR/USD |
1.0800-1.1700 |
1.1000-1.1900 |
1.1200-1.2100 |
1.1300-1.2200 |
MARKET UPDATE
In April the US dollar weakened notably against the euro in terms of London closing rates, from 1.0811 to 1.1325. In addition, the dollar weakened sharply against the yen, from 149.69 to 142.85. The FOMC did not meet in April and hence the range for the federal funds rate was unchanged at 4.25% to 4.50%, the level reached following 100bps of cuts last year. The FOMC is reducing its securities holdings with the pace of QT cut in March through the cap of UST bonds allowed to roll off the balance sheet being reduced from USD 25bn per month to just USD 5bn. The pace of reduction in the holdings of MBS has been running at around USD 15bn per month.
OUTLOOK
The dollar fell sharply further in April. Over March and April, the dollar (DXY basis) fell by -7.6% as investor fears over Trump policies doing damage to the economy intensified. The reciprocal tariffs announced on 2nd April were way higher than expected and no worst case scenarios assumed bilateral US-China tariffs of 145%/125%. While other high reciprocal tariffs above the baseline 10% have been postponed for 90 days to early July, other sector-specific tariffs (autos, steel & aluminium with more to come) and threats of more (pharma, chips) mean uncertainty remains elevated. The extraordinary tariff levels have left investors believing Trump could follow through with other ideas previously believed as highly unlikely. Firing Fed Chair Powell (we still think unlikely) and orchestrating more specifically a weaker dollar (again we see as still unlikely) are now no longer unthinkable. This is fuelling a belief that the era of “US Exceptionalism” could be coming to an end. This we do believe and even prior to April believed the poor state of the US fiscal position was simply not compatible with exceptionalism. Foreign investors own USD 18.5trn worth of US equities (as of end-2024) so even a 5% reduction in US equity exposures would equate to between USD 900bn and USD 1 trillion in US dollar selling. US assets are over-owned and further US dollar weakness is very likely.
The sentiment data has deteriorated notably but forward looking hard data as yet does not show any notable worsening. Q1 GDP contracted by 0.3% but this reflected a surge in imports ahead of expected tariffs. Net trade shaved 4.83ppts off total GDP. Consumer confidence expectations plunged to a level last seen in 2011 after the debt ceiling crisis when US equities plunged while those expecting fewer jobs availability surged to the high April 2009 during the GFC. Layoff announcements have surged reflected DOGE government jobs firings. The NFP jobs reports should soon start to show this deterioration and will be the trigger for the Fed delivering three 25bp rate cuts before the end of the year.
The dollar has weakened sharply in the last two months and hence some consolidation may follow over the short-term. Nonetheless, the stage is set for a further decline of the dollar with a US economic slowdown, Fed rate cuts and doubts over the credibility of US policy making undermining investor confidence.
INTEREST RATE OUTLOOK
|
Interest Rate Close |
Q2 2025 |
Q3 2025 |
Q4 2025 |
Q1 2026 |
|
|
Policy Rate |
4.33% |
4.13% |
3.63% |
3.63% |
3.38% |
|
3-Month T-Bill |
4.29% |
4.00% |
3.63% |
3.63% |
3.38% |
|
10-Year Yield |
4.16% |
4.25% |
4.38% |
4.25% |
4.00% |
* Interest rate assumptions incorporated into MUFG foreign exchange forecasts.
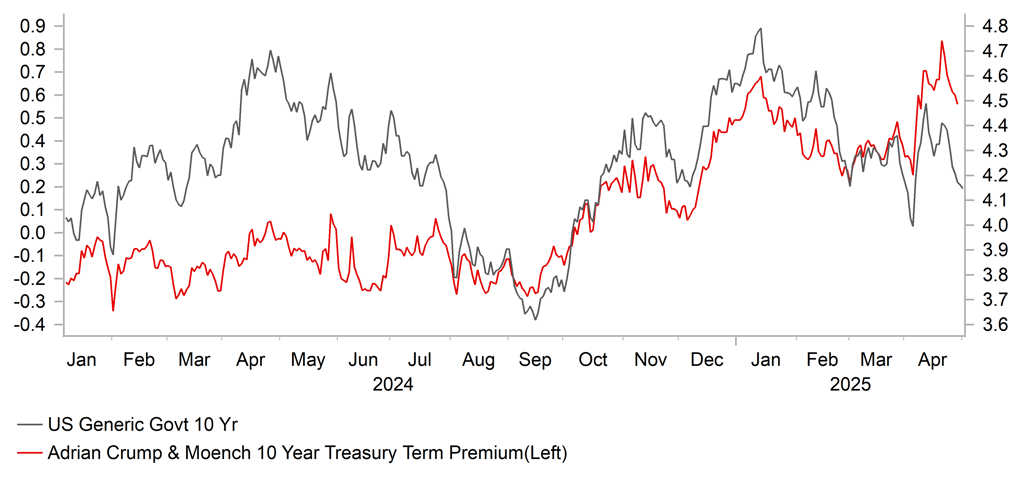
We now have the second occurence where US GDP has fallen back into negative terrority post pandemic. There are a lot of moving parts driving this decline (just like in 2022 - the last negative print). However this time the setup is more concerning given that the labor market is weakening and the consumer has less savings or desire to fullfill “pentup demand.” Underlying momemtum was already weak heading into the tariff liberation day shock, so that only makes matters worse. Its for these reasons that we believe the Fed will ultimately pivot towards rate cuts again – heading into and throughout the summer (when the hard data will show that the US is in or nearing recession). We have maintained that the first rate cut in the series for 2025 would start in June, however we have tweaked our forecast to expect back-to-back cuts versus our original view of the Fed cutting at every other meeting. We have 3 cuts of 25bps in June, July and September. If the Fed skips June, we believe that will force them to come back with a 50bp cut again in July and/or continue on with 25bp cuts to then potentially deliver up to 100bps of cuts again this year (just like they did in 2024). Net net, the sooner they get started the less they potentially need to do as the economy attempts to rebound into early 2026.
(George Goncalves)
TERM PREMIUM ESTIMATE VS. US GOVT 10YR
Source: Bloomberg, Macrobond
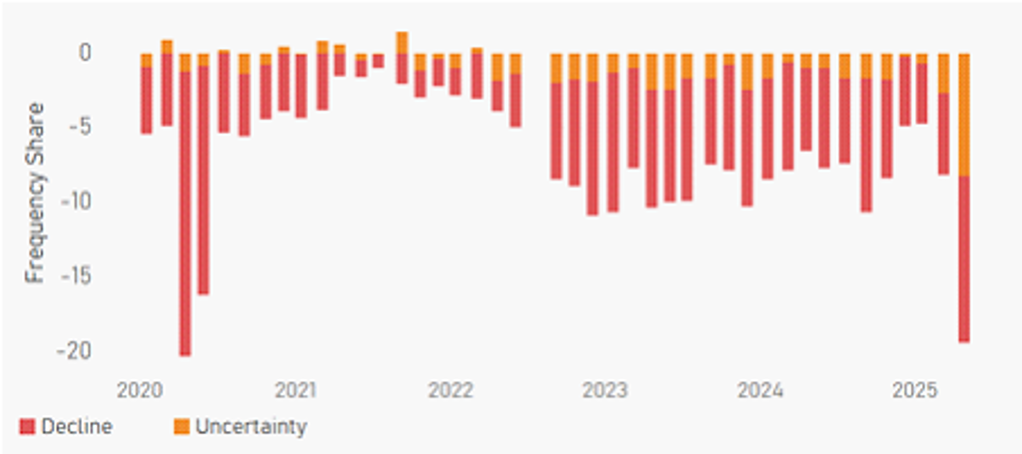
BEIGE BOOK SENTIMENT TOWARDS “DECLINE” AND “UNCERTAINTY”
Source: Bloomberg, Macrobond
Japanese yen
|
Spot close 30.04.25 |
Q2 2025 |
Q3 2025 |
Q4 2025 |
Q1 2026 |
|
|
USD/JPY |
142.85 |
144.00 |
142.00 |
140.00 |
138.00 |
|
EUR/JPY |
161.78 |
161.30 |
163.30 |
165.20 |
165.60 |
|
Range |
Range |
Range |
Range |
||
|
USD/JPY |
135.00-150.00 |
133.00-148.00 |
131.00-146.00 |
129.00-144.00 |
|
|
EUR/JPY |
154.00-169.00 |
155.00-170.00 |
156.00-171.00 |
156.50-172.00 |
MARKET UPDATE
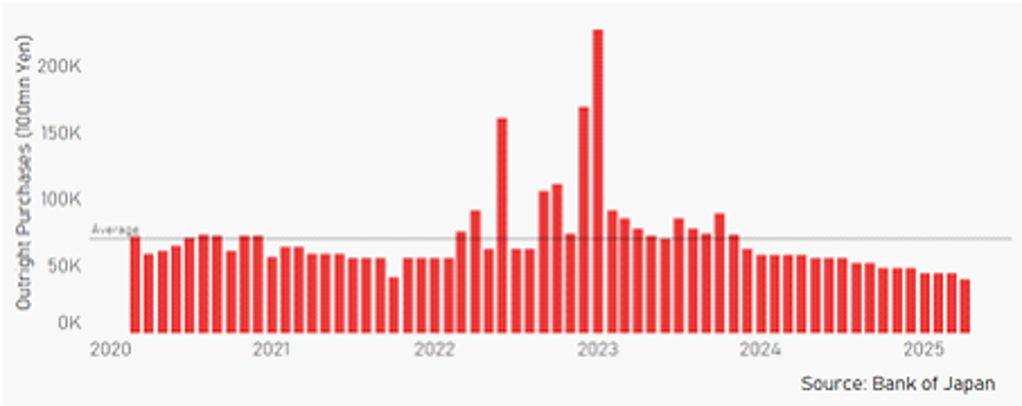
In April the yen strengthened versus the US dollar in terms of London closing rates from 149.69 to 142.85. However, the yen gained only marginally versus the euro from 161.83 to 161.78. The BoJ did not meet in April and hence the key policy rate was unchanged at 0.50%, following the 25bp hike in January, the first 25bp rate hike since before the GFC in 2007. The BoJ is also continuing with the policy of cutting JGB purchases that was announced last July with purchases cut by JPY 400bn per quarter, resulting in the BoJ’s balance sheet declining by 7-8% by Q1 2026.
OUTLOOK
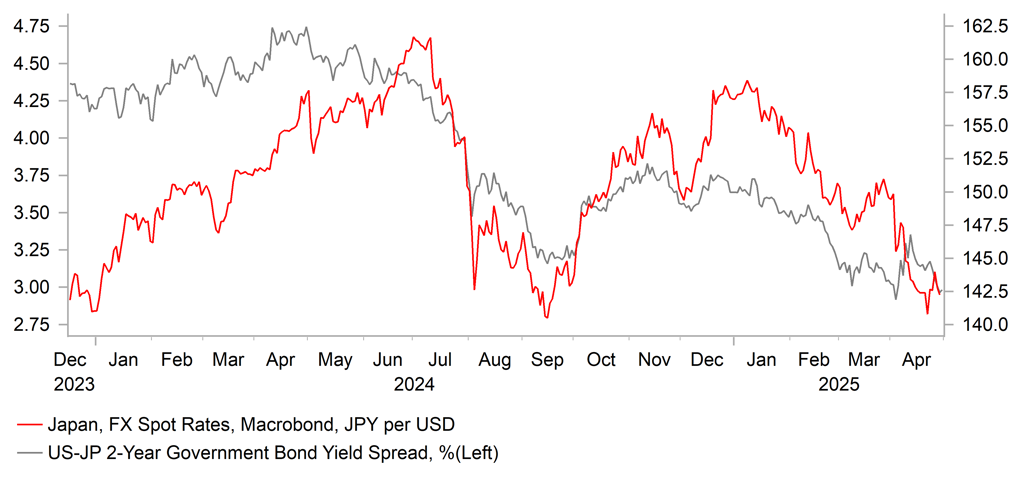
The yen advanced notably in April and, after lagging behind most G10 currencies in March, was the third best performing currency helped by the increased risk aversion fuelled by the reciprocal tariff announcement by Trump on 2nd April with tariff rates that were way higher than expected. The postponement of those tariff for three months helped reverse some of the move but rates in the US have remained under downward pressure given the increased prospect of a marked slowdown and possibly recession in the US. The 2-year UST bond yield declined 28bps as the flow of economic data indicated a negative impact on growth is imminent given the high level of uncertainty. DOGE-related job cuts saw a surge in job cut announcements, consumer confidence expectations of labour market conditions in 6mths worsened sharply while the ISM employment index fell sharply. Slower growth will see the FOMC cutting rates three times in H2 and that will push USD/JPY lower.
Japan’s Life Insurance companies provided some guidance on securities investment plans for the new fiscal year with some indicating caution over JGB buying on concerns over higher yields while there was also some evidence of increased appetite for FX-hedged foreign bonds. That interest should continue to slowly revive given the narrowing yield differentials and given the strong consensus of further JPY appreciation ahead. The BoJ is set to meet at the start of May and while there is little chance of a policy change given the global uncertainty, we expect the BoJ to maintain its guidance that further rate hikes are likely if the BoJ’s inflation forecasts are realised. While there are some uncertainties over the outlook for the economy due to global growth uncertainties, the structural labour market changes mean the BoJ will likely be more willing to look beyond near-term episodes of volatility and maintain its medium-term view of further rate hikes. If the turmoil was severe enough, the BoJ altering its communication and signalling a reluctance to hike would have limited impact on yen direction given US recession risks would increase sharply and USD/JPY would fall sharply in sync with front-end yields in the US.
US recession risks that drive US yields could soon start to dominate USD/JPY influence replacing BoJ policy speculation. Weakening US growth that helps ease inflation concerns would be the ideal scenario for further yen gains and we see that scenario as most likely going forward.
INTEREST RATE OUTLOOK
|
Interest Rate Close |
Q2 2025 |
Q3 2025 |
Q4 2025 |
Q1 2026 |
|
|
Policy Rate |
0.50% |
0.50% |
0.75% |
0.75% |
1.00% |
|
3-Month Bill |
0.38% |
0.50% |
0.70% |
0.80% |
0.90% |
|
10-Year Yield |
1.32% |
1.35% |
1.50% |
1.60% |
1.70% |
* Interest rate assumptions incorporated into MUFG foreign exchange forecasts.
The 10-year JGB yield declined in April, by 17bps to close at 1.32%. The US Treasury 10-year yield declined as well but the JGB yield move was much larger. The larger move reflects to some degree the expected impact from Trump’s trade tariffs with the inflation risk much higher for the US than elsewhere globally. The expected hit to global trade and growth raises questions over the ability of the BoJ to follow through with further rate hikes. So far, the communication from the BoJ has been consistent with increased caution but still an intent to raise rates if economic conditions continue to unfold as the BoJ expects. At this stage we are maintaining our view that the BoJ will be in a position to hike two more times by Q1 2026 given the structural changes in Japan point to sustained inflation going forward. The risk to this view is a further sharp pick-up in global financial market volatility, a US recession and a sharp appreciation of the yen. The risk at this juncture is certainly that the BoJ may deliver less and that JGB yields are lower but conditions would need to deteriorate notably to derail the BoJ completely from hiking again.
USD/JPY VS. SHORT TERM YIELD SPREAD
Source: Bloomberg, Macrobond
BOJ’S OUTRIGHT JGB PURCHASES
Euro
|
Spot close 30.04.25 |
Q2 2025 |
Q3 2025 |
Q4 2025 |
Q1 2026 |
|
|
EUR/USD |
1.1325 |
1.1200 |
1.1500 |
1.1800 |
1.2000 |
|
EUR/JPY |
161.78 |
161.30 |
163.30 |
165.20 |
165.60 |
|
Range |
Range |
Range |
Range |
||
|
EUR/USD |
1.0800-1.1700 |
1.1000-1.1900 |
1.1200-1.2100 |
1.1300-1.2200 |
|
|
EUR/JPY |
154.00-169.00 |
155.00-170.00 |
156.00-171.00 |
156.50-172.00 |
MARKET UPDATE
In April the euro strengthened notably versus the US dollar in terms of London closing rates, moving from 1.0811 to 1.1325. The ECB at its meeting in April cut the key policy rate by 25bps to 2.25%, and followed 150bp of cuts since last year. The ECB is running down APP securities and started PEPP run-off in July last year with about EUR 425bn of securities estimated to roll off the balance sheet in 2025.
OUTLOOK
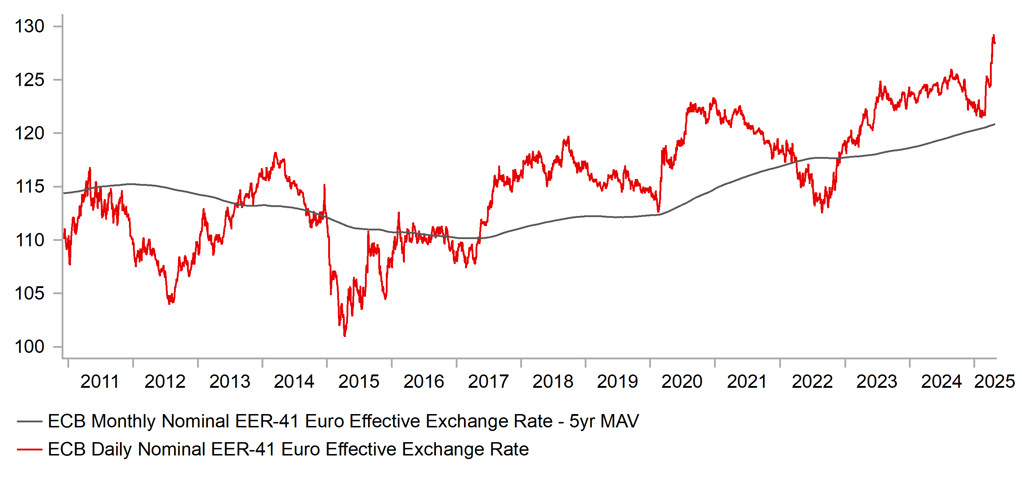
The euro advanced sharply further in April – the EUR EER-41 index jumped by 2.9% in April, the largest gain since the high volatility period in the early stages of covid in 2020. Looking at EUR gains over March and April in EER-41 terms and versus the US dollar (5.4% & 9.2% respectively), the gains were the largest since the volatility during the period following the GFC and the start of the Fed’s QE2 program in 2010. There have been many occasions when the EUR has suffered losses during periods of volatility and risk-off but usually due to euro-specific factors – the euro-zone debt crisis in 2011-12, the sustained period of negative ECB policy rates that began in 2014 and then the Russia invasion of Ukraine. We now see the fundamental back drop as more favourable for EUR to attract safe-haven flows. The euro-zone runs a substantial current account surplus with the 12mth sum currently close to a record high at over EUR 400bn, or around 2.5% of GDP. Germany’s sovereign bond market is set to expand notably more than previously expected following the announcement of a EUR 1 trillion expansion in fiscal spending on infrastructure and defence.
The scale of the euro move over March and April certainly points to the potential for consolidation or even some modest reversal. The economic outlook remains clouded by the tariff uncertainty and the prospect of a 20% reciprocal tariff being introduced when the postponement period expires in early July. The ECB’s measures of 1 & 3-year inflation expectations jumped in March and in general business confidence indices declined. ZEW expectations for economic growth plunged from +39.8 to -18.5 with trade tariff uncertainty set to act as a drag on growth. Given the EUR surge and the likely restrained nature of retaliation by the EU, the ECB is set to focus on the demand hit to growth rather than the inflation risks, which should open up the scope for more rate cuts than we were originally expecting. There are indirect implications for Europe as well given the bilateral stand-off between the US and China will harm global growth. We now expect the ECB to lower the key policy rate into accommodative territory by cutting a further 75bps this year to 1.50%. Given the OIS market is currently priced for that and that the FOMC will likely cut by a similar amount, we doubt it will result in a turn lower for the euro.
The scale of the advance for EUR/USD in April was larger than we expected and hence we have raised our forecast profile further. A US slowdown, the Trump administration’s perceived desire for a weaker dollar and increased fiscal spending in Germany will all help support further gradual EUR appreciation ahead.
INTEREST RATE OUTLOOK
|
Interest Rate Close |
Q2 2025 |
Q3 2025 |
Q4 2025 |
Q1 2026 |
|
|
Policy Rate |
2.25% |
2.00% |
1.75% |
1.50% |
1.50% |
|
3-Month Bill |
2.07% |
1.95% |
1.70% |
1.50% |
1.55% |
|
10-Year Yield |
2.44% |
2.40% |
2.30% |
2.50% |
2.80% |
* Interest rate assumptions incorporated into MUFG foreign exchange forecasts.
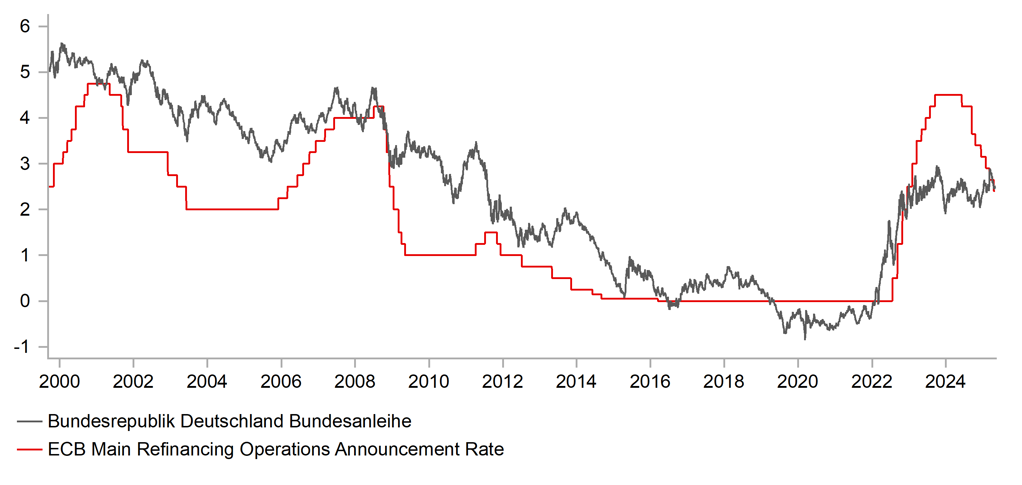
The 10-year bund yield fell notably in April, by 30bps to close at 2.44%. The drop in April means that the surge higher in the 10-year yield on 5th March in response to the German fiscal stimulus announcement has fully reversed. The donward pressure on yields in April came primarily from concerns over growth due to the reciprocal tariff announcement by President Trump on 2nd April which included rates way higher than investors expected. A 20% rate for Europe was suspended until early July in order for negotiations to take place. Given the large US trade deficit with the euro-zone it seems more likely than not that the 20% rate will go live in July and hence some degree of retaliation against the US is likely. Most ECB officials seem to view the tariff uncertainty as disinflationary and with growth set to remain weak and with China and Asia goods potentially set to boost supply into the euro-zone, we see the ECB delivering further easing. We have added an additional 50bps of easing for this year. The risk to this view is that retaliation from the EU is more aggressive than expected, leading to greater ECB caution. Still, based on our view and modest declines in UST yields, we expect only a modest rise in bund yields.
EUR EER-41 INDEX VS. MAVG
Source: Bloomberg, Macrobond
ECB POLICY RATE, % VS. GERMAN 10YR
Source: Bloomberg, Macrobond
Pound Sterling
|
Spot close 30.04.25 |
Q2 2025 |
Q3 2025 |
Q4 2025 |
Q1 2026 |
|
|
EUR/GBP |
0.8496 |
0.8500 |
0.8600 |
0.8650 |
0.8700 |
|
GBP/USD |
1.3330 |
1.3180 |
1.3370 |
1.3640 |
1.3790 |
|
GBP/JPY |
190.42 |
189.70 |
189.90 |
191.00 |
190.30 |
|
Range |
Range |
Range |
Range |
||
|
GBP/USD |
1.2750-1.3750 |
1.2800-1.3850 |
1.2850-1.3950 |
1.2900-1.4100 |
MARKET UPDATE
In April the pound strengthened against the US dollar in terms of London closing rates from 1.2919 to 1.3330. However, the pound weakened against the euro from 0.8368 to 0.8496. The MPC did not meet in April and hence the key policy rate was unchanged at 4.50% following three 25bp cuts in this easing cycle – in February and August and November of last year.
OUTLOOK
Like all G10 currencies, the pound advanced versus the US dollar in April as President Trump’s trade tariff announcements undermined confidence in US assets. However, the pound underperformed and only AUD and NOK gained by less versus the US dollar. As we have highlighted here before, two-thirds of UK exports to the US are in services which means the direct impact on the UK is less than other countries with higher exposures. However, the UK will still be impacted indirectly and with confidence in UK growth already fragile, the uncertainty has damaged sentiment. The fact that US Treasury bonds suffered a sell-off even as equity markets declined has increased investor concerns over the UK’s position as well. Just prior to the tariff announcements, Chancellor Reeves announced a budget that was intended to address fiscal uncertainties in the UK and restore confidence in Gilts. The trade uncertainty and hit to growth has effectively undone the fiscal credibility once again. The auto-specific tariffs will have a bigger impact given the US is the UK auto-sector’s biggest market. The threat of pharmaceutical-sector tariffs would also be damaging for the UK with these products the second largest export to the US.
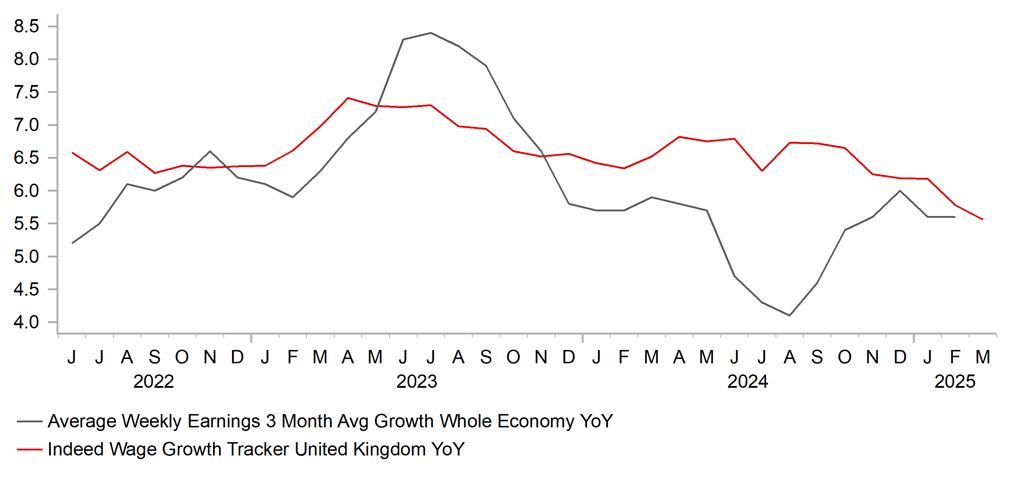
The economy continues to show mixed signs with GDP up a very robust 0.5% m/m in February while wage growth remains elevated. But overall the data was consistent with our view that the MPC can continue to cut the key policy rate in a “gradual, careful” manner. The CPI data was weaker than expected while the monthly PAYE employment data showed a 78k drop in jobs after an 8k drop in February. It was the largest drop since the initial phase of covid in 2020. Most BoE comments indicate a leaning more toward trade tariffs being a hit to growth and being deflationary although views have been quite mixed. A May rate cut seems very likely given the weakening of labour demand but moves beyond then will be dependent on supply shortages been modest and inflation relatively contained. We expect the BoE to sustain the pace of a 25bp cut per quarter over the forecast period. If demand for labour was to continue to weaken it could open up a faster pace of cuts towards the end of the year.
We expect the pound to advance versus the US dollar given our bearish dollar view while the euro is likely to outperform the pound on greater safe-haven flows as financial market volatility remains more elevated than usual. However, the outperformance for the euro should be modest leaving EUR/GBP in a relatively narrow trading range.
INTEREST RATE OUTLOOK
|
Interest Rate Close |
Q2 2025 |
Q3 2025 |
Q4 2025 |
Q1 2026 |
|
|
Policy Rate |
4.50% |
4.25% |
4.00% |
3.75% |
3.50% |
|
3-Month Bill |
4.31% |
4.30% |
3.95% |
3.70% |
3.55% |
|
10-Year Yield |
4.44% |
4.40% |
4.20% |
4.20% |
4.30% |
* Interest rate assumptions incorporated into MUFG foreign exchange forecasts.
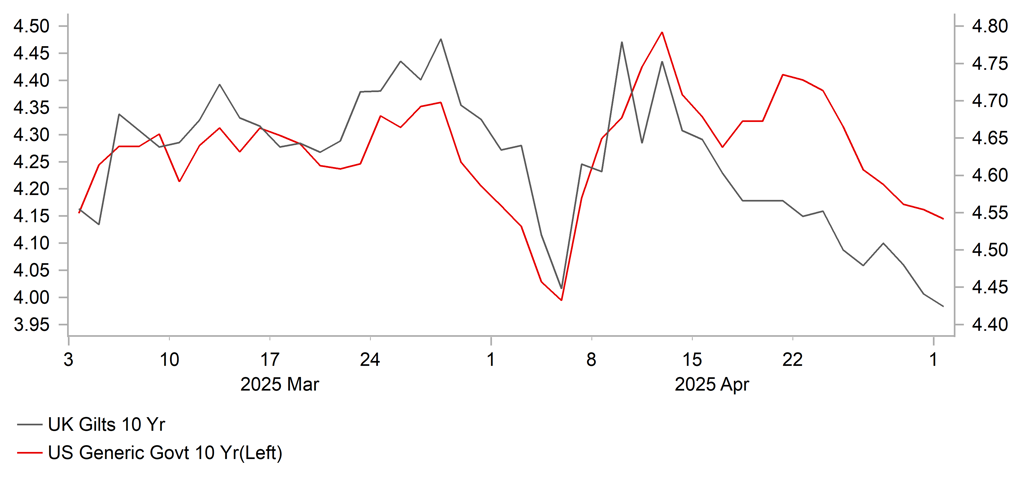
The 10-year Gilt yield declined in April, by 24bps to close at 4.44%. Yield moves have been volatile and the Gilt market is at risk of renewed turmoil in the US Treasury bond market. The surge higher in US Treasury bond yields (10yr +73bps intra-day low-to-high in 5 trading days) resulted in a 44bps swing in three trading days for Gilts. Given the UK’s past fiscal crisis under former PM Truss in 2022 and the stickiness of wage growth and greater fiscal uncertainties, long-term yields in the UK look more vulnerable than in other key economies. The Bank of England’s slow pace of monetary easing could also be playing a role in keeping long-term yields higher. Nonetheless, despite the uncertainties, we still expect Gilt yields to come down based on the assumption that the UK government is unlikely to retaliate aggressively to US trade tariffs and given the signs that the labour market is weakening. That should help ease wage growth going forward. Inflation is receding a little faster than the BoE assumed. The BoE could feasibly move away from its QT policy if longer-term yields were seen to counter the transmission of appropriate policy. We expect 10-year Gilt yields to decline gradually over the forecast period.
AVG WEEKLY EARNINGS VS. INDEED WAGE GROWTH TRACKER
Source: Bloomberg, Macrobond
UK GILTS 10YR VS. UST 10YR
Source: Bloomberg, Macrobond
Chinese renminbi
|
Spot close 30.04.25 |
Q2 2025 |
Q3 2025 |
Q4 2025 |
Q1 2026 |
|
|
USD/CNY |
7.2698 |
7.4000 |
7.4500 |
7.4000 |
7.3500 |
|
USD/HKD |
7.7550 |
7.7700 |
7.7700 |
7.7700 |
7.7700 |
|
Range |
Range |
Range |
Range |
||
|
USD/CNY |
7.0500-7.5000 |
7.1000-7.5500 |
7.0500-7.5000 |
7.0000-7.4500 |
|
|
USD/HKD |
7.7300-7.8100 |
7.7300-7.8100 |
7.7300-7.8100 |
7.7300-7.8100 |
MARKET UPDATE
In April, USD/CNY moved from 7.2564 to 7.2698. On 21st April, the PBoC kept the 1Y and 5Y LPR at 3.10% and 3.60% respectively. In the Politburo meeting held on 25th April, the government reiterated plans to cut the RRR and policy rate at appropriate times to support the economy and maintain sufficient liquidity.
OUTLOOK
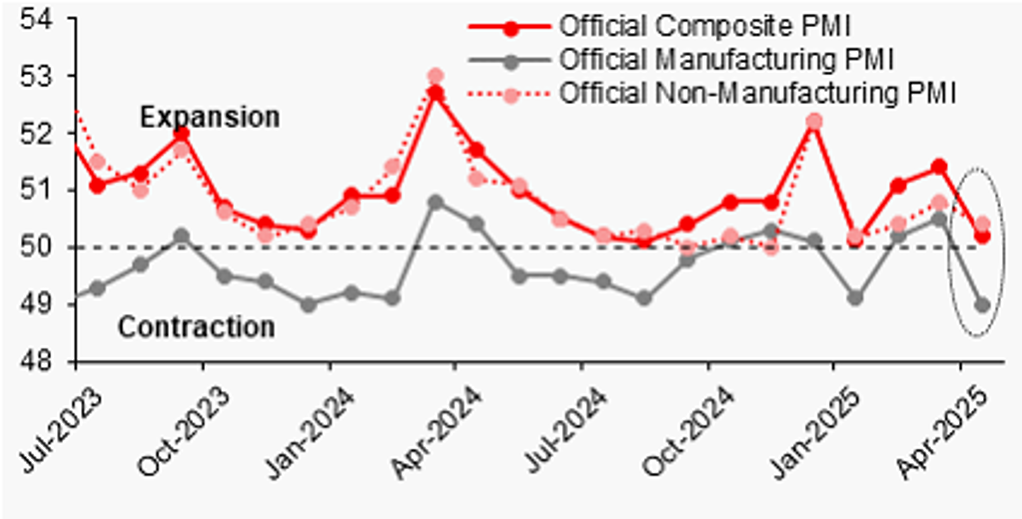
China’s 1Q GDP growth of 5.4%yoy was a positive surprise to us and the market, and March’s monthly macro numbers were largely better-than-expected as well with improvement in the growth of exports, industrial production, FAI and retail sales. Overall the economy remained in deflation with the GDP deflator falling by -0.8%yoy, and the housing recovery remaining sluggish in March. We expect GDP growth to decelerate in Q2, as the negative impact of tariffs materializes and large fiscal easing may only arrive in Q3 and beyond. April’s weaker official PMIs were a harbinger for the upcoming economic stress. The manufacturing PMI declined sharply from 50.5 in March to 49.0 in April, especially dragged lower by a sharp decline in new export orders from 49.0 to 44.7. The non-manufacturing PMI reading declined to 50.4 in April from 50.8 in March. The composite PMI posted a quite mild expansionary reading of 50.2 compared to 51.4 in March. Meanwhile, Bloomberg’s high-frequency data shows the 15-day rolling total of laden container ship tonnage (in TEU) for departures from China to the US has dropped significantly from 462k on 22nd April to 317k on 29th April. The latest reading is way below the 2024 daily average of 420k.
The Chinese government clarified that there is no negotiation with the US on tariffs yet. China introduced measures on 28th April to provide support for employment and the economy to cushion the impact from US tariffs. Key measures include strengthening vocational skills training, tailored policies for exporters to mitigate risks, promoting service consumption and automobile sales, introducing new policy-based financial instruments, among others. Monetary wise, the PBoC net injected RMB 500bn through 1Y MLF in April, the largest since Dec 2023, indicating its desire to provide support for the economy. Looking ahead, we are expecting: 1) the Chinese government to roll out more fiscal stimulus after there is more clarity on tariffs, 2) the headwind to the economy is too large to be fully offset by the existing government initiatives, even if the ultimate total tariffs US imposes on Chinese goods are to be lowered back towards 40%, and 3) the current USD/CNY level of 7.2600 doesn’t fully reflect the potential damage of tariffs on China’s economy. We expect the pair to rise to 7.4000 by the end of Q2. The 90-day tariffs pause that US gave to other counties, and potential lengthy process of tariff negotiation would imply further depreciation of CNY to 7.4500 by Q3. Our forecasts for a broadly weaker US dollar (measured by the DXY index) in Q3 and Q4 would provide support for the CNY. As a result we expect some mild recovery for CNY against the dollar in Q4 2025 and Q1 2026.
INTEREST RATE OUTLOOK
|
Interest Rate Close |
Q2 2025 |
Q3 2025 |
Q4 2025 |
Q1 2026 |
|
|
LPR 1Y |
3.10% |
2.90% |
2.70% |
2.70% |
2.70% |
|
MLF 1Y |
2.00% |
1.70% |
1.50% |
1.50% |
1.50% |
|
7-Day Repo Rate |
1.50% |
1.30% |
1.10% |
1.10% |
1.10% |
|
10-Year Yield |
1.63% |
1.60% |
1.65% |
1.70% |
1.80% |
* Interest rate assumptions incorporated into MUFG foreign exchange forecasts.
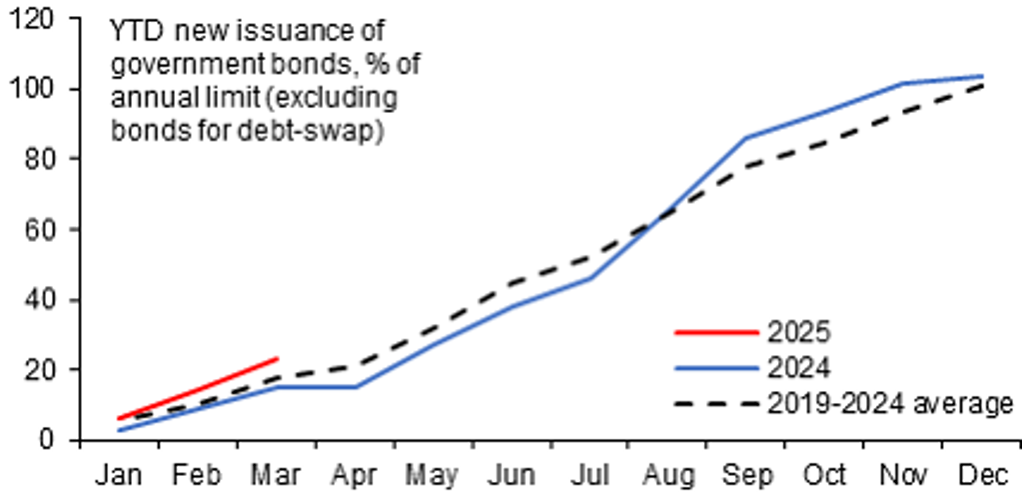
In April, China’s 10-year government bond yield dropped by nearly 20bps to current 1.63%. For the rest of the Q2, we expect a further modest decline for the 10-year government bond yield for several reasons: 1) the PBOC maintains an easing bias on monetary policy; 2) the lack of clarify for the US tariffs in the near term means there is unlikely to be a large step-up in fiscal stimulus as early as in May or Q2. In Q1, the net increase of government bonds (both central and local) increased to a strong number of RMB2.5 trillion, and it is less likely now there will be further acceleration of the pace of government (net) bond issuance in Q2. Bond supply would cap/weigh on the bond yields. Additionally, in contrast to relatively resilient exports and domestic production in recent months, the sharp decline in the April manufacturing PMI index and its sub-indexes of producer prices, new export orders and new orders are indicating that China’s economy has started to feel the negative tariff shock. External factors are likely to continue to weigh on domestic sentiment in the near term.
OFFICIAL PMI READINGS DECLINED SHARPLY IN APRIL
Source: : Bloomberg, MUFG GMR
FRONT-LOADED GOVERNMENT BONDS ISSUANCE IN Q1 2025
Source: : Bloomberg, MUFG GMR
