
Please download PDF from above for the following currencies.
Australian dollar // New Zealand dollar //Canadian dollar // Norwegian krone // Swedish Krona // Swiss franc // Czech koruna // Hungarian forint //Polish zloty // Romanian leu // Russian rouble // South African rand // Turkish lira // Indian rupee // Indonesian rupiah // Malaysian ringgit // Philippine peso //Singapore dollar // South Korean won // Taiwan dollar // Thai baht // Vietnamese dong // Argentine peso // Brazilian real // Chilean peso // Mexican peso // Saudi riyal // Egyptian pound
Monthly Foreign Exchange Outlook
DEREK HALPENNY
Head of Research, Global Markets EMEA and International Securities
Global Markets Research
Global Markets Division for EMEA
E: derek.halpenny@uk.mufg.jp
LEE HARDMAN
Senior Currency Analyst
Global Markets Research
Global Markets Division for EMEA
E: lee.hardman@uk.mufg.jp
LIN LI
Head of Global Markets Research Asia
Global Markets Research
Global Markets Division for Asia
E: lin_li@hk.mufg.jp
KHANG SEK LEE
Associate
Global Markets Research
Global Markets Division for Asia
E: khangsek_lee@hk.mufg.jp
MICHAEL WAN
Senior Currency Analyst
Global Markets Research
Global Markets Division for Asia
E: michael_wan@sg.mufg.jp
LLOYD CHAN
Senior Currency Analyst
Global Markets Research
Global Markets Division for Asia
E: lloyd_chan@sg.mufg.jp
SOOJIN KIM
Analyst, ESG and Emerging Markets Research – EMEA
DIFC Branch – Dubai
E: soojin.kim@ae.mufg.jp
MUFG Bank, Ltd.
A member of MUFG, a global financial group
May 2026
KEY EVENTS IN THE MONTH AHEAD
1) DEAL OR NO DEAL?
Optimism at the end of May was high that negotiations between the US and Iran were close to finalising a deal that would extend the ceasefire by 60 days and crucially reopen the Strait of Hormuz. The more contentious issues around Iran’s nuclear energy ambitions and sanctions on Iran and frozen assets would then be negotiated over that extended period. But at the time of print still no deal has been announced although dialogue is reportedly continuing. Brent crude oil fell close to 20% in May and hence we would conclude that much of the good news related to this deal being agreed is already in the price. Brent would likely fall to the high 80’s range but likely no more given the high level of uncertainty that would continue. How quickly tanker traffic would pick up is unclear with Iran apparently given 30 days to clear mines from the Strait of Hormuz. With AI-related optimism continuing to drive global equities to records we also doubt a deal would prompt much additional risk taking.
2) JUNE A BUSY MONTH FOR CENTRAL BANKS
Nine G10 central banks will meet in June and whether these meetings take place against a backdrop of the Strait of Hormuz reopened or still closed will matter a lot to the tone and forward guidance communications. The only G10 central bank not meeting in June is the RBNZ. Of the nine meeting in June, the ECB is the central bank closest to fully priced for a 25bp hike to be delivered. A speech by President Lagarde in late May on the importance of action to enhance credibility points strongly to a hike being delivered on 11th June. The BoJ is the other central bank with a 25bp hike substantially priced (80%) and again communication from numerous BoJ officials on the value of avoiding being behind the curve points to a hike on 16th June. We expect 25bp hikes from both the ECB and the BoJ. While the Fed will not act this month (17th) the meeting will be a huge focus given the post-meeting press conference will be the first time we hear from new Fed Chair Kevin Warsh. If a ceasefire extension is confirmed by then and the Strait of Hormuz has reopened, we would expect Chair Warsh to emphasise the capacity to look through the energy price shock. He has mentioned trimmed mean inflation measures as a focus, and he may well highlight the stability of certain trimmed mean inflation rates. That would reinforce our dollar downside forecast path in H2 and into 2027.
3) MONITORING DEVELOPMENTS POST TRUMP-XI SUMMIT
The Trump-Xi summit established a framework of “constructive strategic stability” that serves as guardrails for US-China relations. Meanwhile, the structure, functions and operating model of the US–China Board of Trade and Board of investment remain to be seen. The Board of Trade is expected to lower tariffs on “non-sensitive goods” worth at least USD30bn, whereas the Board of investment may likely discuss granting market investment access in non-sensitive sectors. Beyond that, China’s May data release is important to watch after April negative data surprises, and any further deterioration in activities may prompt swift policy responses.
Forecast rates against the US dollar - End-Q2 2026 to End-Q1 2027
Spot close 29.05.26 | Q2 2026 | Q3 2026 | Q4 2026 | Q1 2027 | |
DXY | 98.774 | 100.05 | 97.880 | 96.360 | 96.140 |
JPY | 159.15 | 158.00 | 156.00 | 154.00 | 152.00 |
EUR | 1.1683 | 1.1500 | 1.1800 | 1.2000 | 1.2000 |
GBP | 1.3481 | 1.3220 | 1.3410 | 1.3560 | 1.3560 |
CNY | 6.7658 | 6.7500 | 6.7000 | 6.6500 | 6.6000 |
AUD | 0.7194 | 0.7000 | 0.7100 | 0.7200 | 0.7300 |
NZD | 0.5992 | 0.5850 | 0.6000 | 0.6000 | 0.6050 |
CAD | 1.3781 | 1.3900 | 1.3700 | 1.3500 | 1.3400 |
NOK | 9.2352 | 9.4780 | 9.3220 | 9.2500 | 9.3330 |
SEK | 9.2128 | 9.4780 | 9.1530 | 8.9170 | 8.9170 |
CHF | 0.7809 | 0.7910 | 0.7710 | 0.7630 | 0.7670 |
|
|
|
|
|
|
CZK | 20.781 | 21.300 | 20.680 | 20.170 | 20.080 |
HUF | 302.58 | 317.40 | 309.30 | 300.00 | 300.00 |
PLN | 3.6183 | 3.7220 | 3.6100 | 3.5330 | 3.5170 |
RON | 4.4933 | 4.4780 | 4.3900 | 4.3330 | 4.3500 |
RUB | 70.775 | 75.880 | 75.860 | 77.060 | 79.820 |
ZAR | 16.186 | 17.000 | 16.700 | 16.300 | 16.000 |
TRY | 45.891 | 46.500 | 48.500 | 50.500 | 52.000 |
|
|
|
|
|
|
INR | 94.995 | 95.500 | 95.800 | 96.000 | 96.000 |
IDR | 17876 | 17650 | 17500 | 17350 | 17200 |
MYR | 3.9625 | 3.9000 | 3.8000 | 3.7500 | 3.7000 |
PHP | 61.587 | 62.000 | 61.500 | 61.000 | 60.500 |
SGD | 1.2751 | 1.2650 | 1.2500 | 1.2500 | 1.2400 |
KRW | 1503.3 | 1460.0 | 1440.0 | 1420.0 | 1400.0 |
TWD | 31.339 | 31.100 | 30.900 | 30.700 | 30.500 |
THB | 32.470 | 32.500 | 31.500 | 31.300 | 31.300 |
VND | 26311 | 26400 | 26500 | 26600 | 26700 |
|
|
|
|
|
|
ARS | 1408.4 | 1450.0 | 1500.0 | 1550.0 | 1650.0 |
BRL | 5.0572 | 5.0000 | 5.1000 | 4.9000 | 4.8000 |
CLP | 889.07 | 920.00 | 900.00 | 880.00 | 860.00 |
MXN | 17.339 | 17.600 | 17.500 | 17.450 | 17.400 |
| |||||
SAR | 3.7525 | 3.7500 | 3.7500 | 3.7500 | 3.7500 |
EGP | 52.184 | 49.000 | 49.500 | 50.500 | 52.500 |
Notes: All FX rates are expressed as units of currency per US dollar bar EUR, GBP, AUD and NZD which are expressed as dollars per unit of currency. Data source spot close; Bloomberg closing rate as of 5:00pm London time, except VND which is local onshore closing rate. All consensus forecasts are Bloomberg sourced.
US dollar
Spot close 29.05.26 | Q2 2026 | Q3 2026 | Q4 2026 | Q1 2027 | |
USD/JPY | 159.15 | 158.00 | 156.00 | 154.00 | 152.00 |
EUR/USD | 1.1683 | 1.1500 | 1.1800 | 1.2000 | 1.2000 |
Consensus | Consensus | Consensus | Consensus | ||
USD/JPY | 158.00 | 156.00 | 154.00 | 152.50 | |
EUR/USD | 1.1700 | 1.1800 | 1.1900 | 1.2000 |
MARKET UPDATE
In May the US dollar strengthened against the euro in terms of London closing rates, from 1.1728 to 1.1683. In addition, the dollar strengthened against the yen, from 156.66 to 159.15. The FOMC did not meet in May and hence the range for the federal funds was unchanged at 3.75%-4.00%. The FOMC confirmed the end of QT effective December last year with the Fed no longer reducing UST bond holdings. MBS holdings continue to decline but are offset by buying of US T-bills, now estimated to be running at around USD 25bn per month.
OUTLOOK
The US dollar, on a DXY basis, advanced by 0.9% in May, partially reversing the drop in April as the dynamics in the FX market started to change. Brent crude oil and risk became less influential in driving the US dollar and there was a shift back to the more traditional driver – rate spreads. This was prompted by the jump in US yields as investors reassessed the Fed policy stance and considered the need for monetary tightening given the continued rise in inflation pressures. The 2-year UST bond yield jumped by 13bps in May whereas in Europe, the 2-year yield dropped by 11bps and the UK the drop was a larger, 24bps. US yields basically played catch-up from underpriced risks of hikes while in Europe investors viewed hiking as overpriced. The risk now is that the momentum higher for yields in the US could reverse if this reported US-Iran deal is confirmed and energy prices fall further. That said, we do not expect initial big moves. Brent crude oil is already close to 20% down in just two weeks and hence much of the good news associated with a deal is priced.
While the argument put forward of the need for a rate hike in the US remains unconvincing in our view it is clear that the debate on Fed policy has shift from no change or a cut to no change or a hike with most comments from Fed officials now assessing the risks between a hike or no hike. The FOMC minutes from the April meeting indicating broadening support for the implied easing bias to be dropped and a growing view that a hike would be needed if inflation remained elevated. However, we should not underestimate the potential influence of Fed Chair Warsh. He is known to favour trimmed measures of inflation as a more accurate measure of underlying inflation conditions and the Dallas Fed Trimmed Mean YoY CPI rate fell to 2.3% in April – the measure has been stable around this level for three months and the lowest since August 2021. If a US-Iran extended ceasefire deal is agreed, then Warsh will push this view harder and that will likely result in the rates curve removing the current pricing of a risk of hikes back to the potential for easing.
US inflation data is likely to show a pick-up in the coming months but happening in the context of a 60-day deal extension and the reopening of the Strait of Hormuz will allow Fed officials to look through this and focus on potential downside risks to growth. We see that approach as reinforcing downside risks for the US dollar and hence we are maintaining our bearish outlook for the dollar over the forecast period.
INTEREST RATE OUTLOOK
Interest Rate Close | Q2 2026 | Q3 2026 | Q4 2026 | Q1 2027 | |
Policy Rate | 3.62% | 3.63% | 3.38% | 3.13% | 3.13% |
3-Month T-Bill | 3.67% | 3.60% | 3.30% | 3.10% | 3.10% |
10-Year Yield | 4.44% | 4.38% | 4.13% | 4.00% | 3.88% |
* Interest rate assumptions incorporated into MUFG foreign exchange forecasts.
We continue to maintain that energy markets will reprice quickly once the strait of Hormuz (SoH) reopens this summer as the incentives for oil producers will be to oversupply in order to jump start USD cash flows that have gone missing for over 3 months. If so, oil futures will go deeper into backwardation as more distant oil futures contracts may collapse towards 75 or below a barrel. All of this hinges on the US/Iran agreeing on some deal, likely a multi-part process that sees the SoH open this summer. We do admit that this is a very binary take. Yet our US rates view does not solely hinge on SoH reopening. In addition, we view incoming Fed Chair Kevin Warsh downplaying the need to hike rates in this current environment and will shift the focus to a new inflation target (trimmed mean) and AI productivity gains driving disinflation. We continue to view the US economy as fragile and at risk of growth relapse. A combination of lower oil in H2, weak labor markets and downside to US growth will result in the markets reintroducing in cuts and the Fed delivering at the end of 2026. We have shifted our forecast up 12.5bps across the curve for 2026 forecasts to reflect a Fed on hold amidst fiscal policy concerns.
(George Goncalves)
DXY VS 2Y UST YIELD CORRELATION
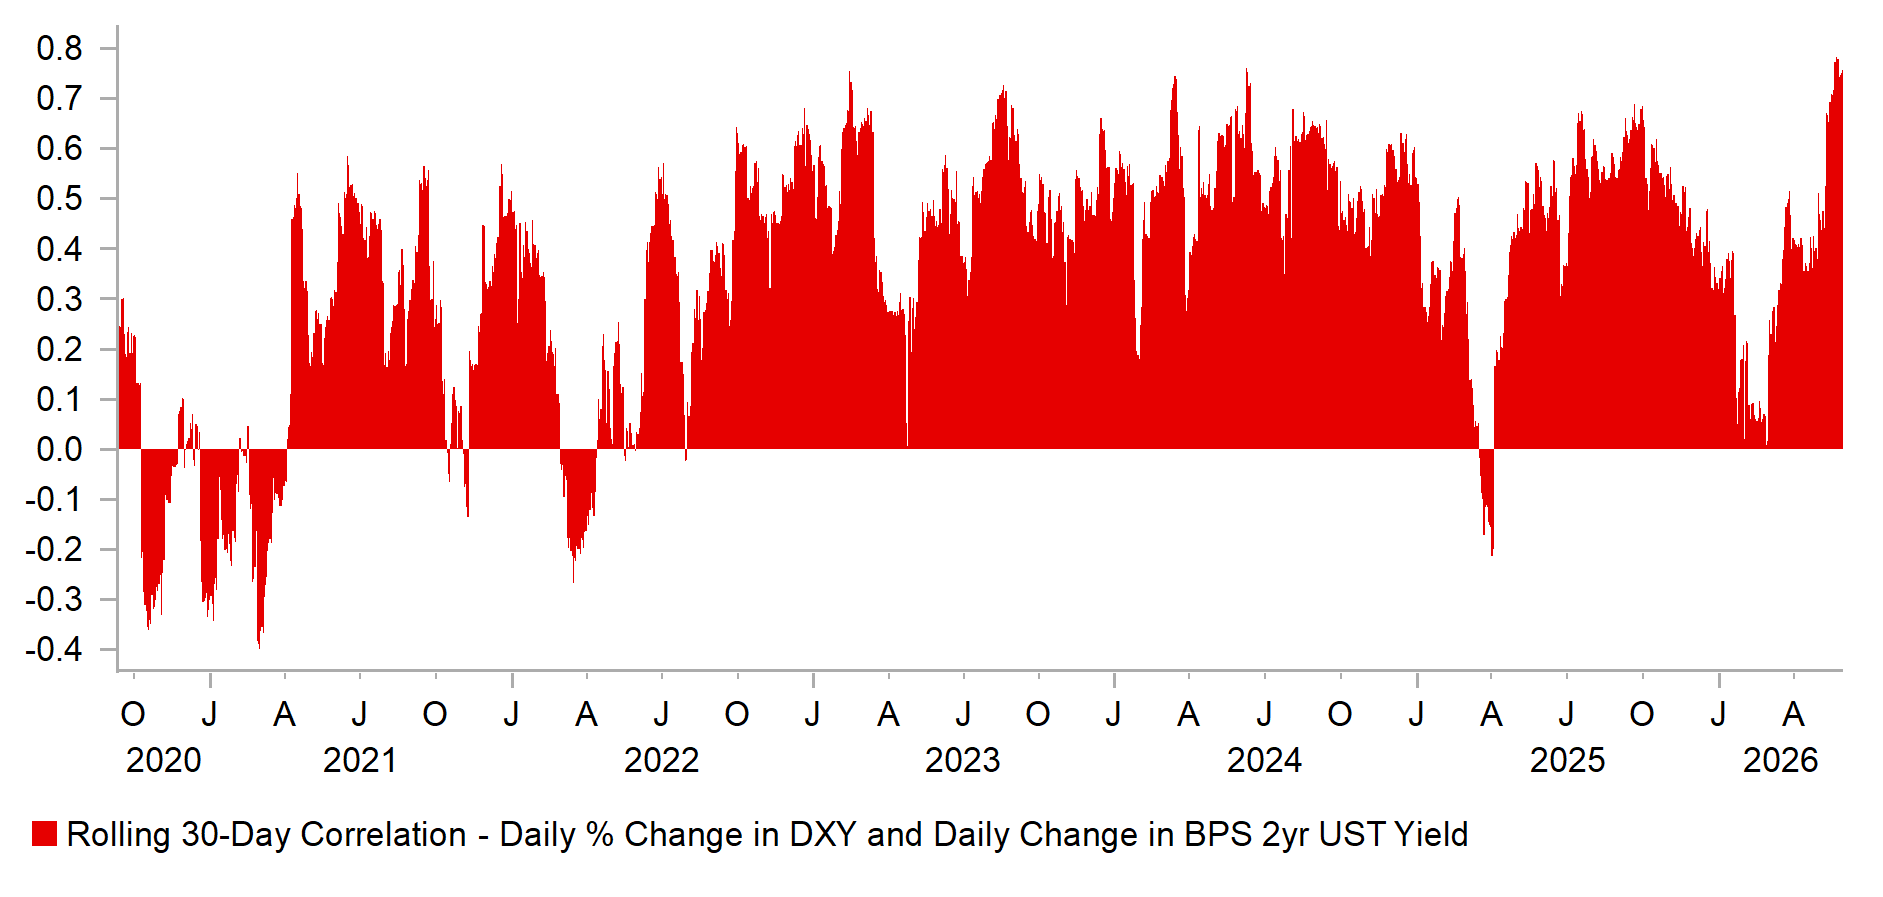
Source: Bloomberg, Macrobond & MUFG GMR
DXY VS. BRENT CRUDE
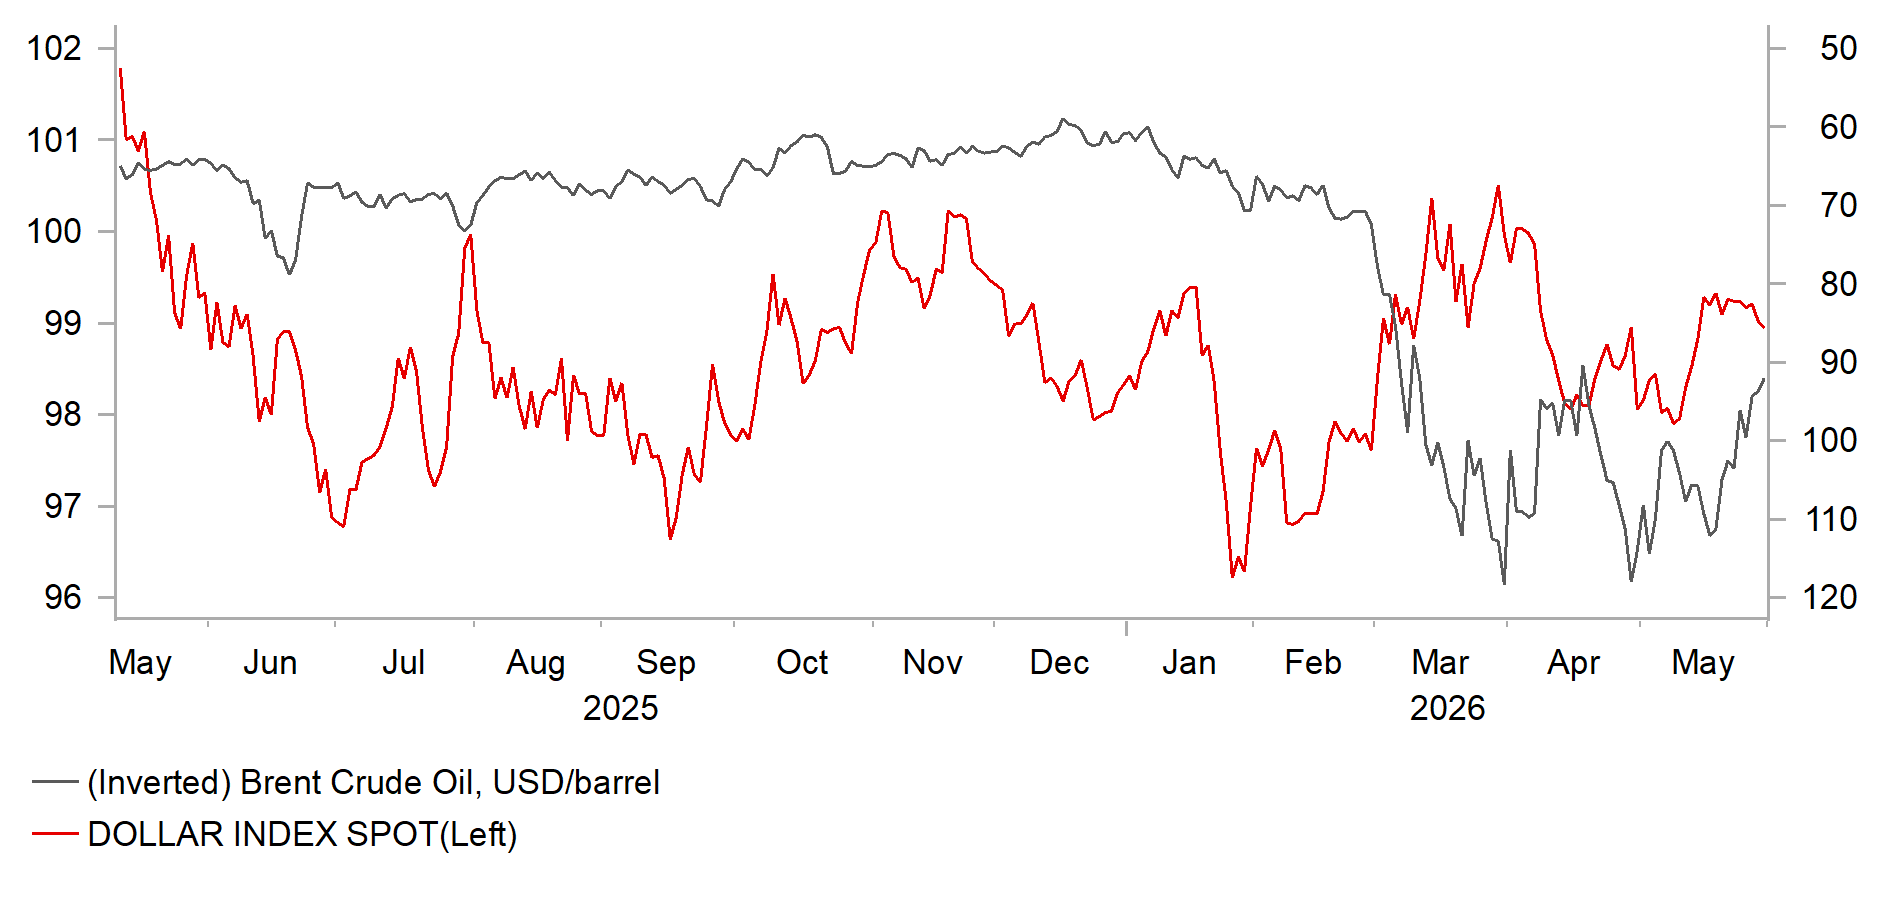
Source: Bloomberg, Macrobond & MUFG GMR
Japanese yen
Spot close 29.05.26 | Q2 2026 | Q3 2026 | Q4 2026 | Q1 2027 | |
USD/JPY | 159.15 | 158.00 | 156.00 | 154.00 | 152.00 |
EUR/JPY | 185.93 | 181.70 | 184.10 | 184.80 | 182.40 |
Consensus | Consensus | Consensus | Consensus | ||
USD/JPY | 158.00 | 156.00 | 154.00 | 152.50 | |
EUR/JPY | 183.50 | 184.00 | 184.00 | 181.00 |
MARKET UPDATE
In May the yen weakened versus the US dollar in terms of London closing rates from 156.66 to 159.15. In addition, the yen weakened marginally versus the euro from 183.73 to 185.93. The BoJ did not meet in May and hence the key policy rate was unchanged at 0.75%, following the 25bp hike in December, the second 25bp rate hike since 2007. The BoJ is also continuing with the policy of cutting JGB monthly purchases and as was previously announced, the pace of reduction was reduced from JPY 400bn per quarter to JPY 200bn per quarter effective from April.
OUTLOOK
The yen weakened in May and was the worst performing G10 currency which is telling given the MoF confirmed at the end of May that it spent JPY 11.7trn on yen-buying intervention between 28th April and 27th May. The speed in which USD/JPY rebounded from the intervention-induced lows highlighted the failure of intervention that was always going to be challenged by the fundamental backdrop that is outside the control of the Japanese authorities. The rise in global yields and higher energy prices have served to counter the attempts to strengthen the yen. The deal that looks to be close to finalised between the US and Iran will potentially prove the most important influence on curtailing yen selling – crude oil prices have dropped sharply and front-end yields have declined. If sustained, the scope for yen appreciation will be much greater.
The broader backdrop globally will be important for yen direction, but the BoJ does still have a role to play. The level of the key policy rate in real terms remains deeply negative and that continues to weigh on yen performance. Scott Bessent met with Governor Ueda at the G7 and was in Tokyo and in all likelihood, he privately was supporting the prospect of further monetary tightening given he has publicly cited in the past the BoJ policy stance as the primary factor for continued yen weakness. Governor Ueda has stated that risks of second-round inflation effects are high while Deputy Governor Himino spoke of the need to “secure market credibility” in order to tackle inflation. The OIS market currently implies an 80% probability of a hike in June – we expect the BoJ to deliver a hike. Tokyo CPI data for May was weaker than expected but there are temporary factors helping depress inflation – subsidies for gasoline and Tokyo government support to reduce water fees and childcare helped depress CPI. The BoJ’s focus we believe will continue to be on getting the monetary policy framework normalised and with potentially just two more rate hikes the real policy rate (deflated by core-core CPI) will be within the often-cited R* range which we believe will help strengthen credibility and support the yen.
If a deal between the US and Iran is confirmed and if as we assume the BoJ hikes the policy rate to 1.00% in June, the prospects of a turn lower in USD/JPY will be much better. We assume lower US yields as well, and with the USD/JPY / US-JP spread correlation strengthening, this will contribute to yen strength.
INTEREST RATE OUTLOOK
Interest Rate Close | Q2 2026 | Q3 2026 | Q4 2026 | Q1 2027 | |
Policy Rate | 0.75% | 1.00% | 1.00% | 1.25% | 1.25% |
3-Month Bill | 0.87% | 1.10% | 1.10% | 1.30% | 1.30% |
10-Year Yield | 2.67% | 2.50% | 2.50% | 2.60% | 2.60% |
* Interest rate assumptions incorporated into MUFG foreign exchange forecasts.
The 10-year JGB yield increased in May, by 14bps to close at 2.67%, the highest monthly close since May 1997. There is clear evidence of improving bond investor sentiment with most of the long-term and super-long JGB offerings in May being met with stronger demand. The 10-year JGB auction on 12th May resulted in a bid-to-cover of 3.90, up from 2.57 at the auction in April and from the 12mth average of 3.23 and the highest bid-to-cover since September last year. With yields now at record or mulri-decade highs it would be no surprise to see demand to pick up. The JSDA JGB flow data also revealed a broadening of demand from Japanese investors. Trusts have tended to be regular buyers but Lifers and regional banks bought as well. The total buying amongst five key domestic investors was the largest since December 2024. As stated above, further BoJ action is expected and is nearly fully priced into the JGB curve and better BoJ credibility will help improve investor confidence in JGBs. With the yen having the potential to strengthen and energy price risks subsiding, the 10-year JGB yield should soon reach a peak.
USD/JPY US-JP SPREAD CORRELATION HAS BEEN STRENGTHENING
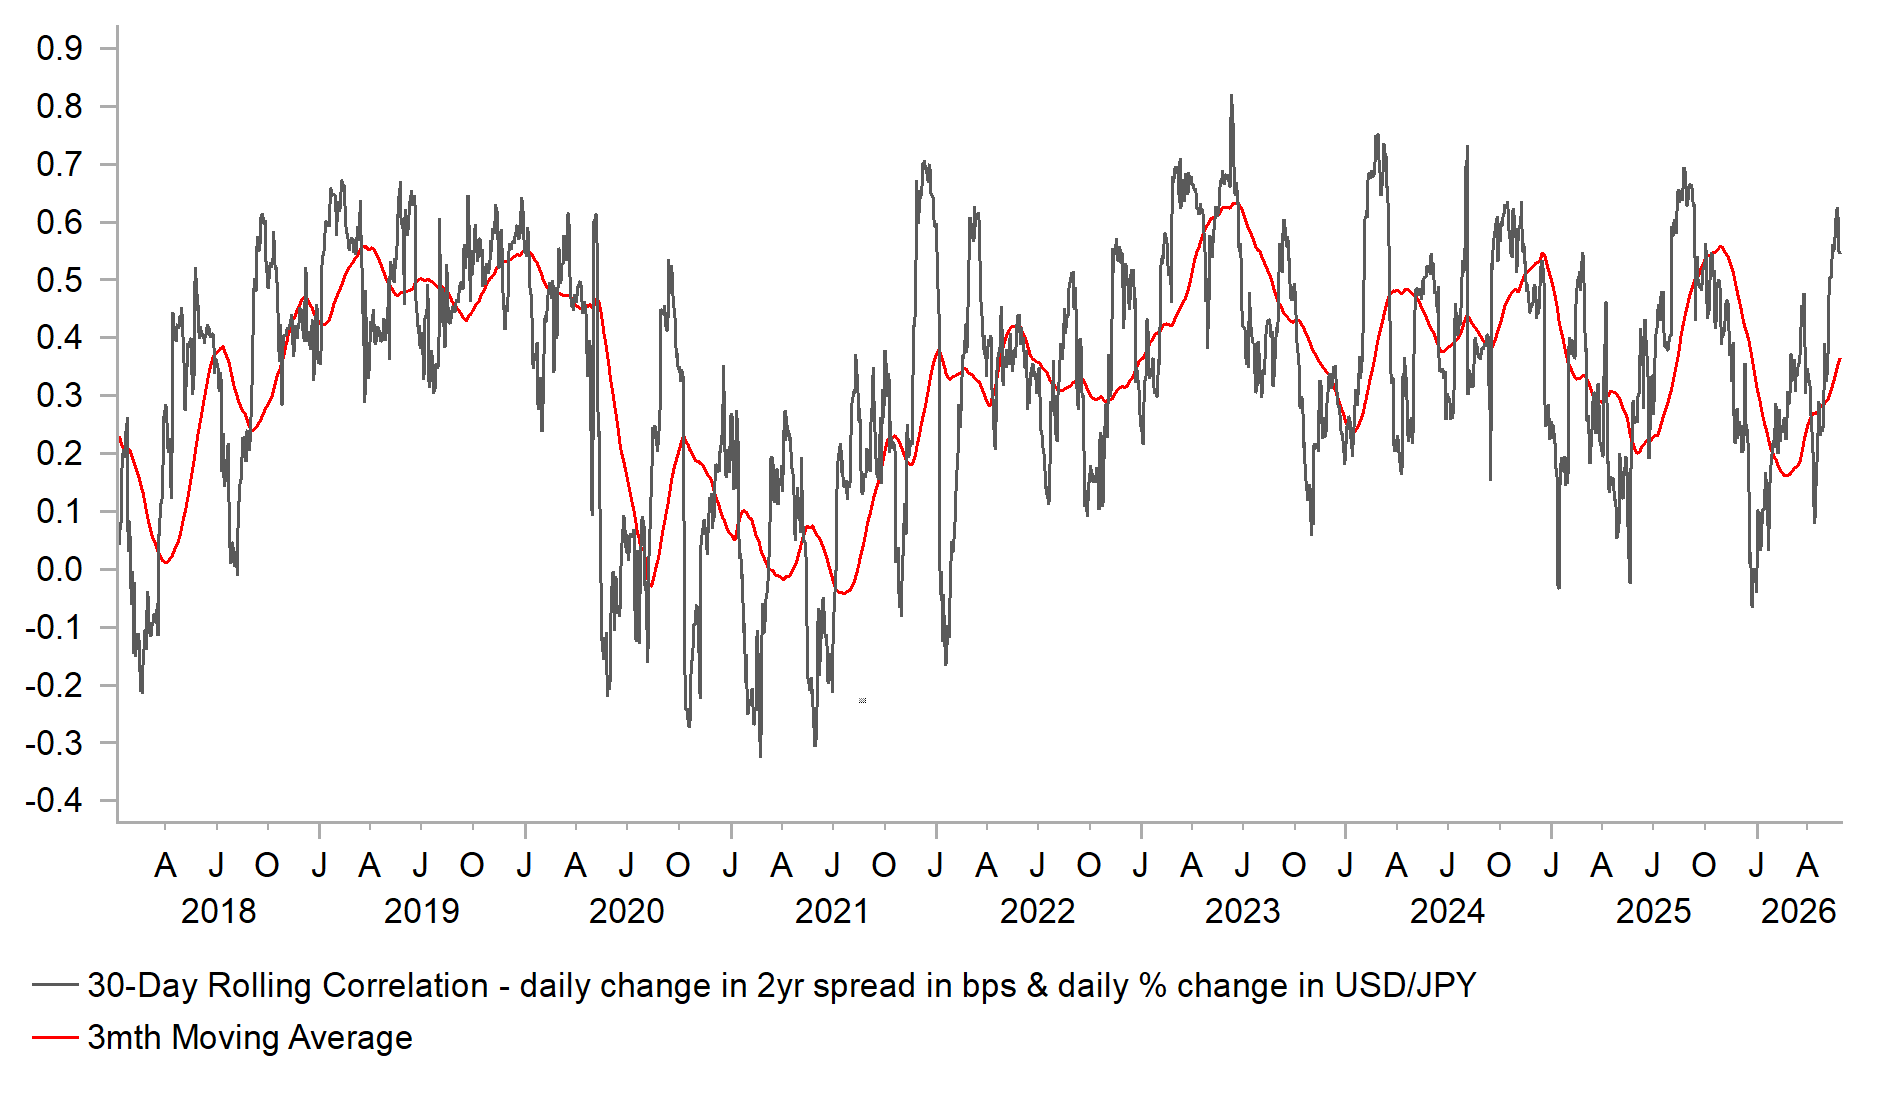
Source: Bloomberg & MUFG GMR
DOMESTIC INVESTOR DEMAND FOR SUPERLONG JGBS PICKING UP
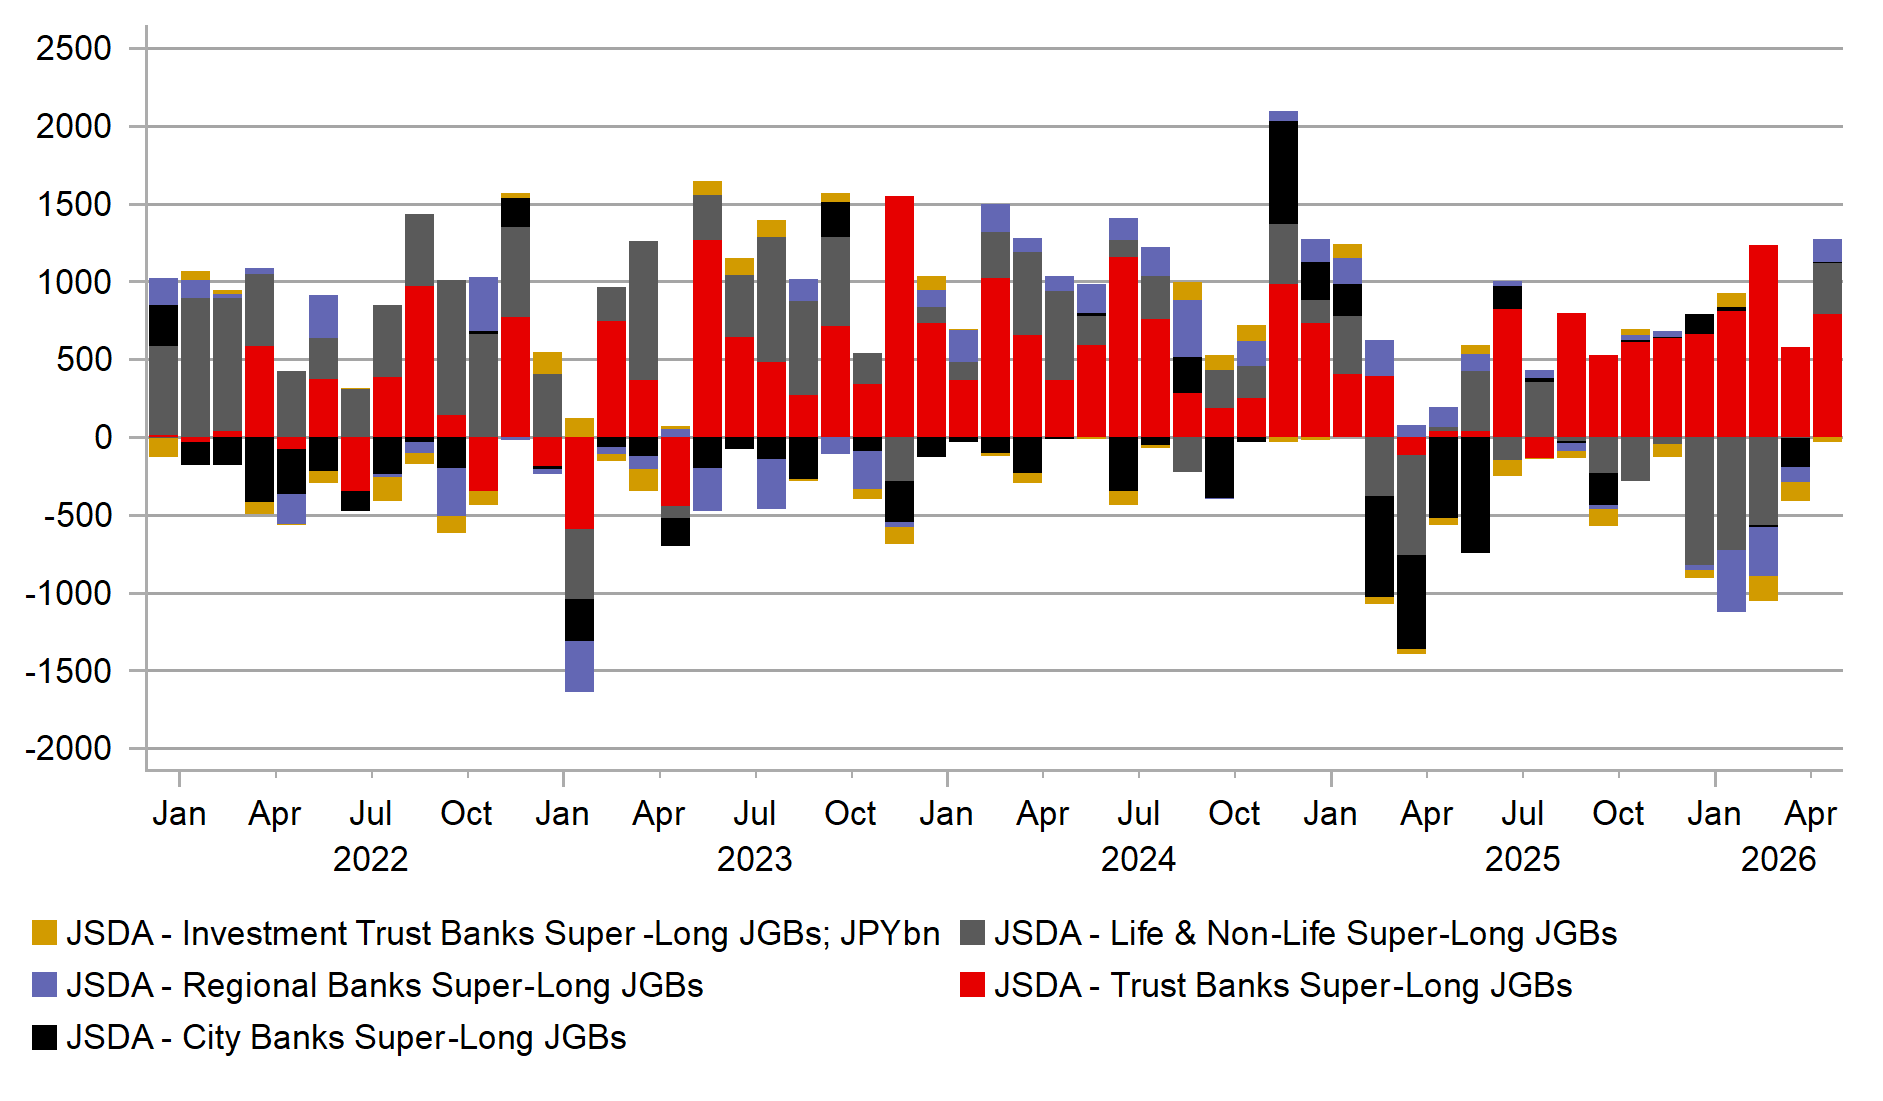
Source: Bloomberg, Macrobond & MUFG GMR
Euro
Spot close 29.05.26 | Q2 2026 | Q3 2026 | Q4 2026 | Q1 2027 | |
EUR/USD | 1.1683 | 1.1500 | 1.1800 | 1.2000 | 1.2000 |
EUR/JPY | 185.93 | 181.70 | 184.10 | 184.80 | 182.40 |
Consensus | Consensus | Consensus | Consensus | ||
EUR/USD | 1.1700 | 1.1800 | 1.1900 | 1.2000 | |
EUR/JPY | 183.50 | 184.00 | 184.00 | 181.00 |
MARKET UPDATE
In May the euro weakened against the US dollar in terms of London closing rates from 1.1728 to 1.1683. The ECB did not meet in May and hence the deposit rate was unchanged at 2.00% - the level reached following 100bps of cuts last year. The cumulative easing amounted to 200bps over 2024-25. QT will continue this year with the ECB’s projected maturities from both APP and PEPP expected to result in a EUR 500bn reduction in balance sheet holdings.
OUTLOOK
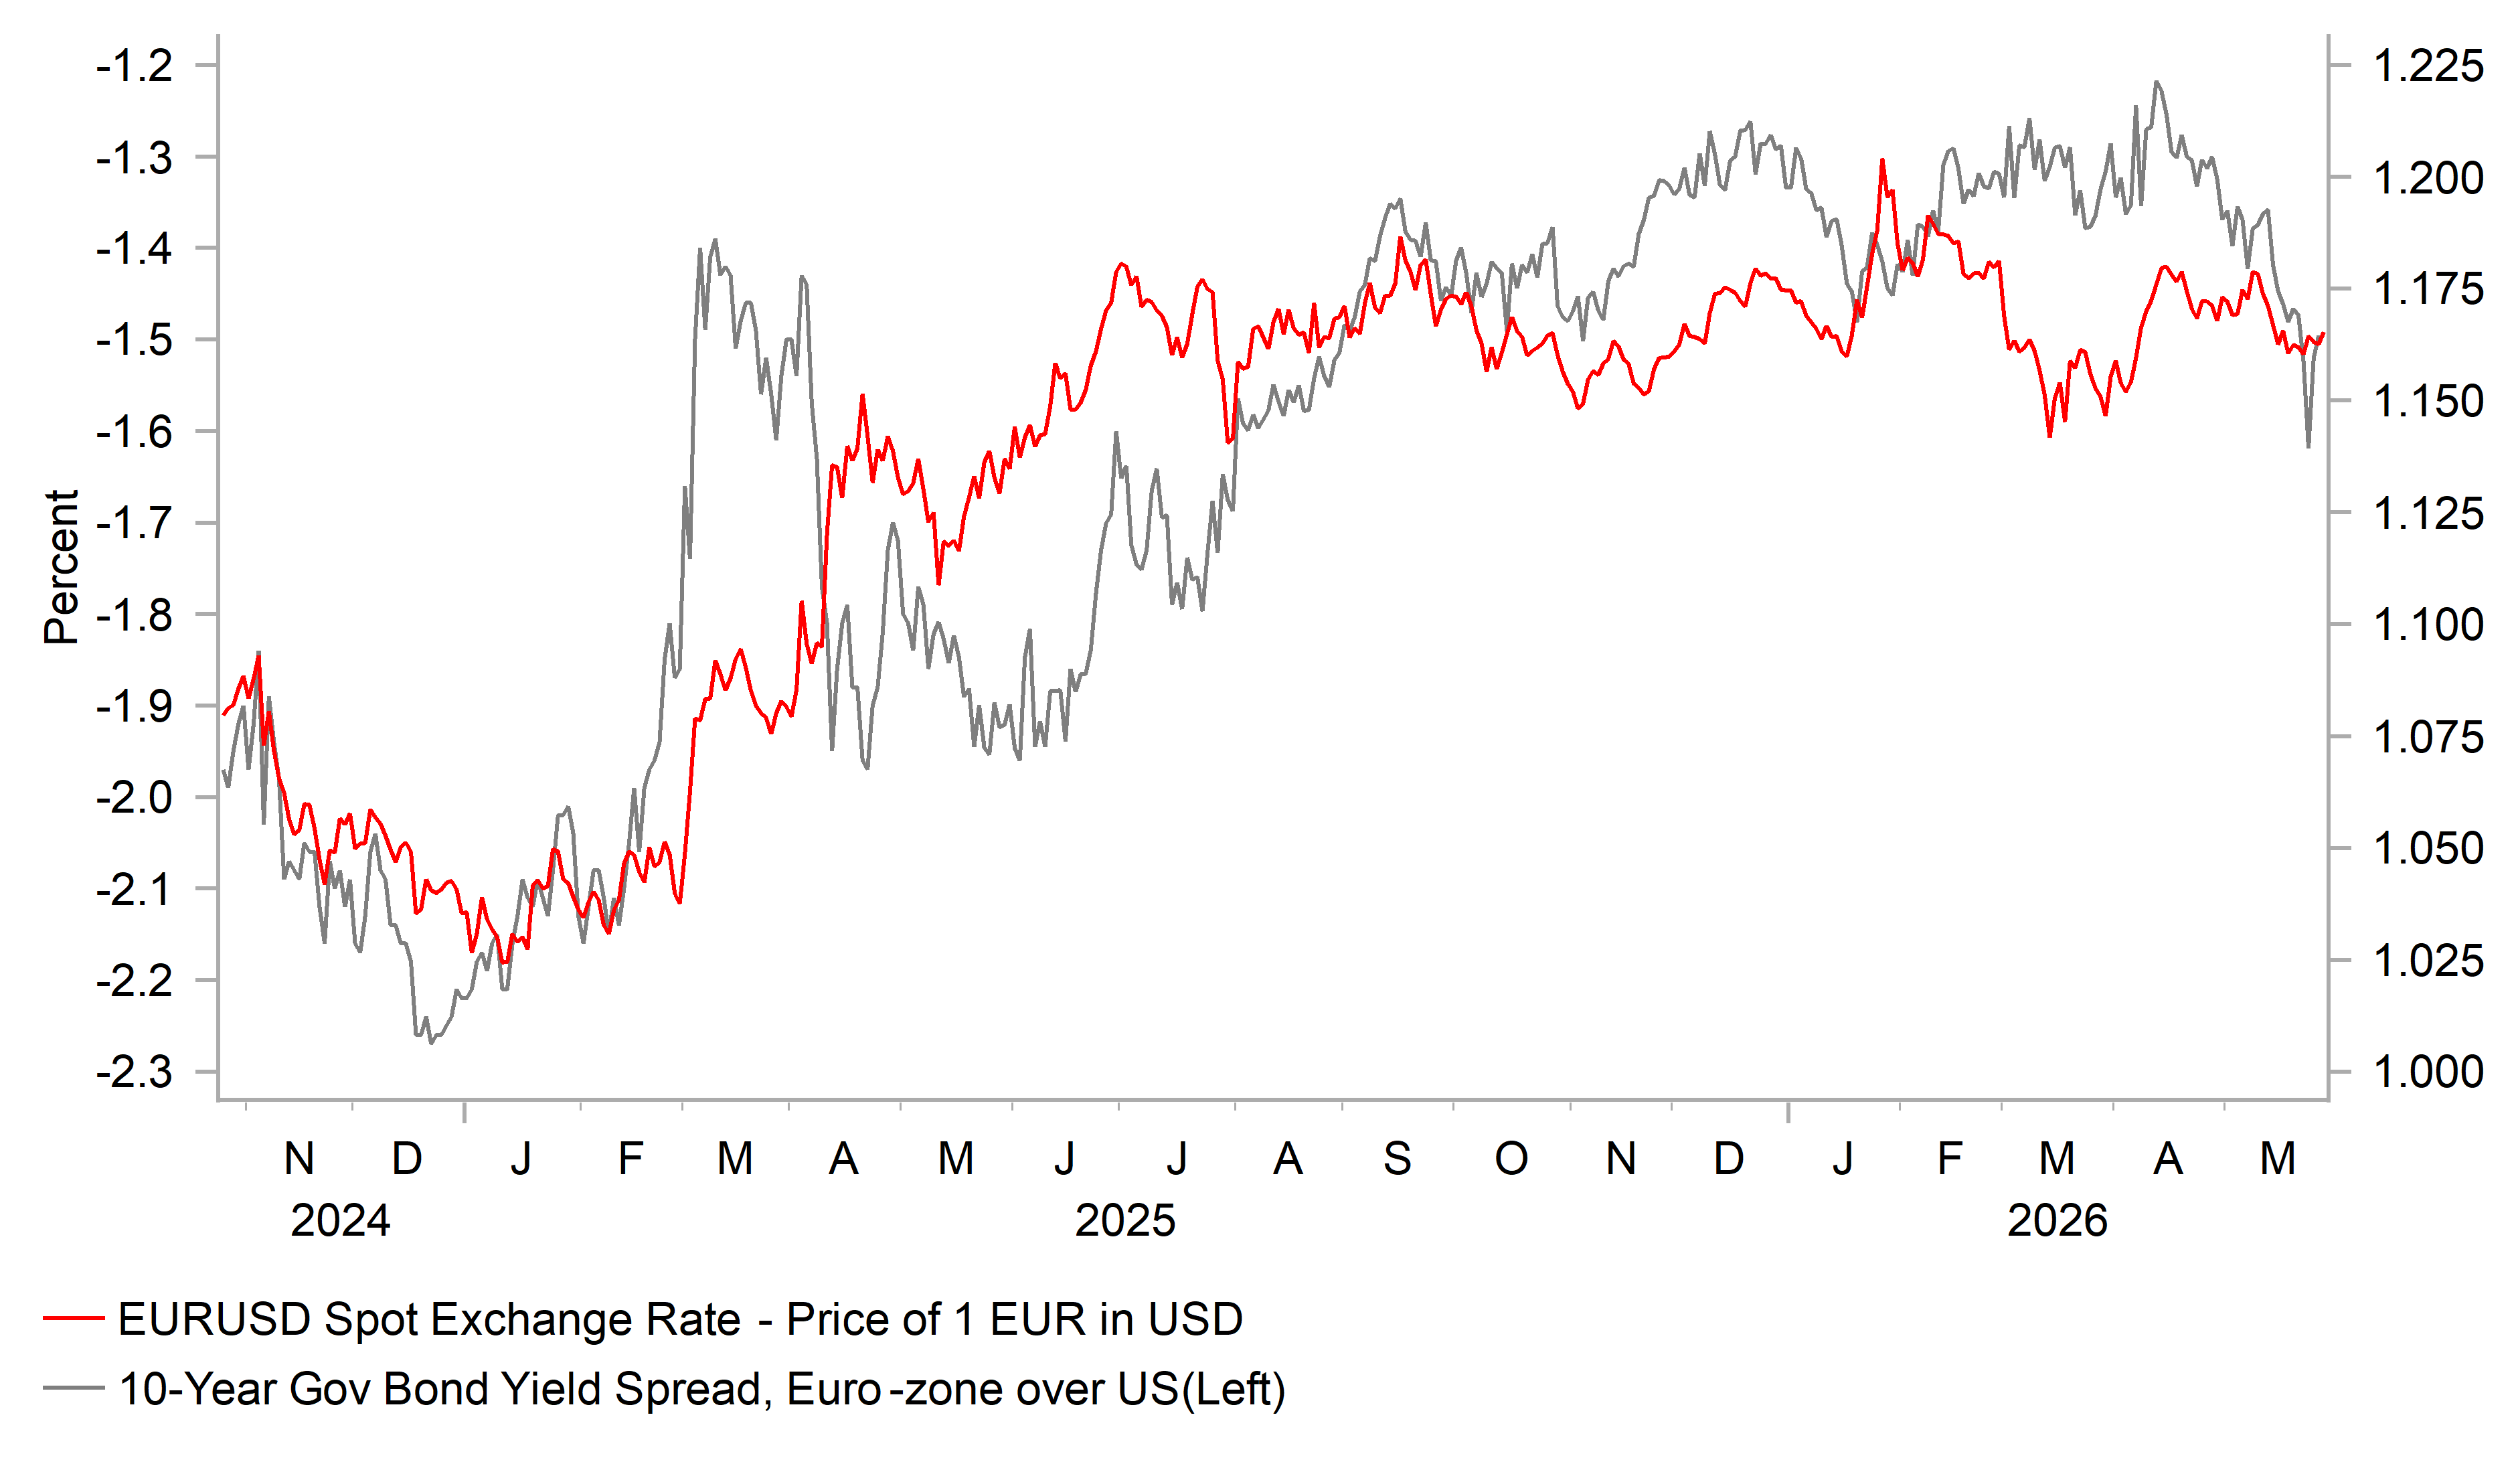
The euro weakened versus the US dollar in May, a month in which the US dollar advanced against most G10 currencies – the performance of the euro was mid-table relative to other G10 currencies. The risks associated with higher crude oil prices continued to vary throughout May as the US-Iran ceasefire held with sporadic interruptions that raised fears of renewed military conflict. With the conflict now three months in and crude oil prices elevated but less volatile, the driver of the US dollar has slowly shifted away from risk and crude oil and back to rate spreads. That shift partly reflected a jump in US yields relative to the rest of the world as Fed rate hike expectations picked up. The 2-year EU-US swap spread fell by a substantial 37bps in May and in that context EUR/USD fell relatively modestly. This was in part down to the ECB being more explicit on plans for monetary tightening. Most of the communication from ECB officials pointed to an intention to hike rates in June. Chief Economist Philip Lane confirmed that the baseline inflation projections would likely be increased in updated forecasts to be released at the June meeting and although he would not be drawn on the exact timing of a possible hike, he stressed that signs of broadening inflation would be a “major issue”. Executive Board member Schnabel was happy to be more blunt stating that the ECB could no longer look through the inflation upturn. A rate hike is close to being fully priced.
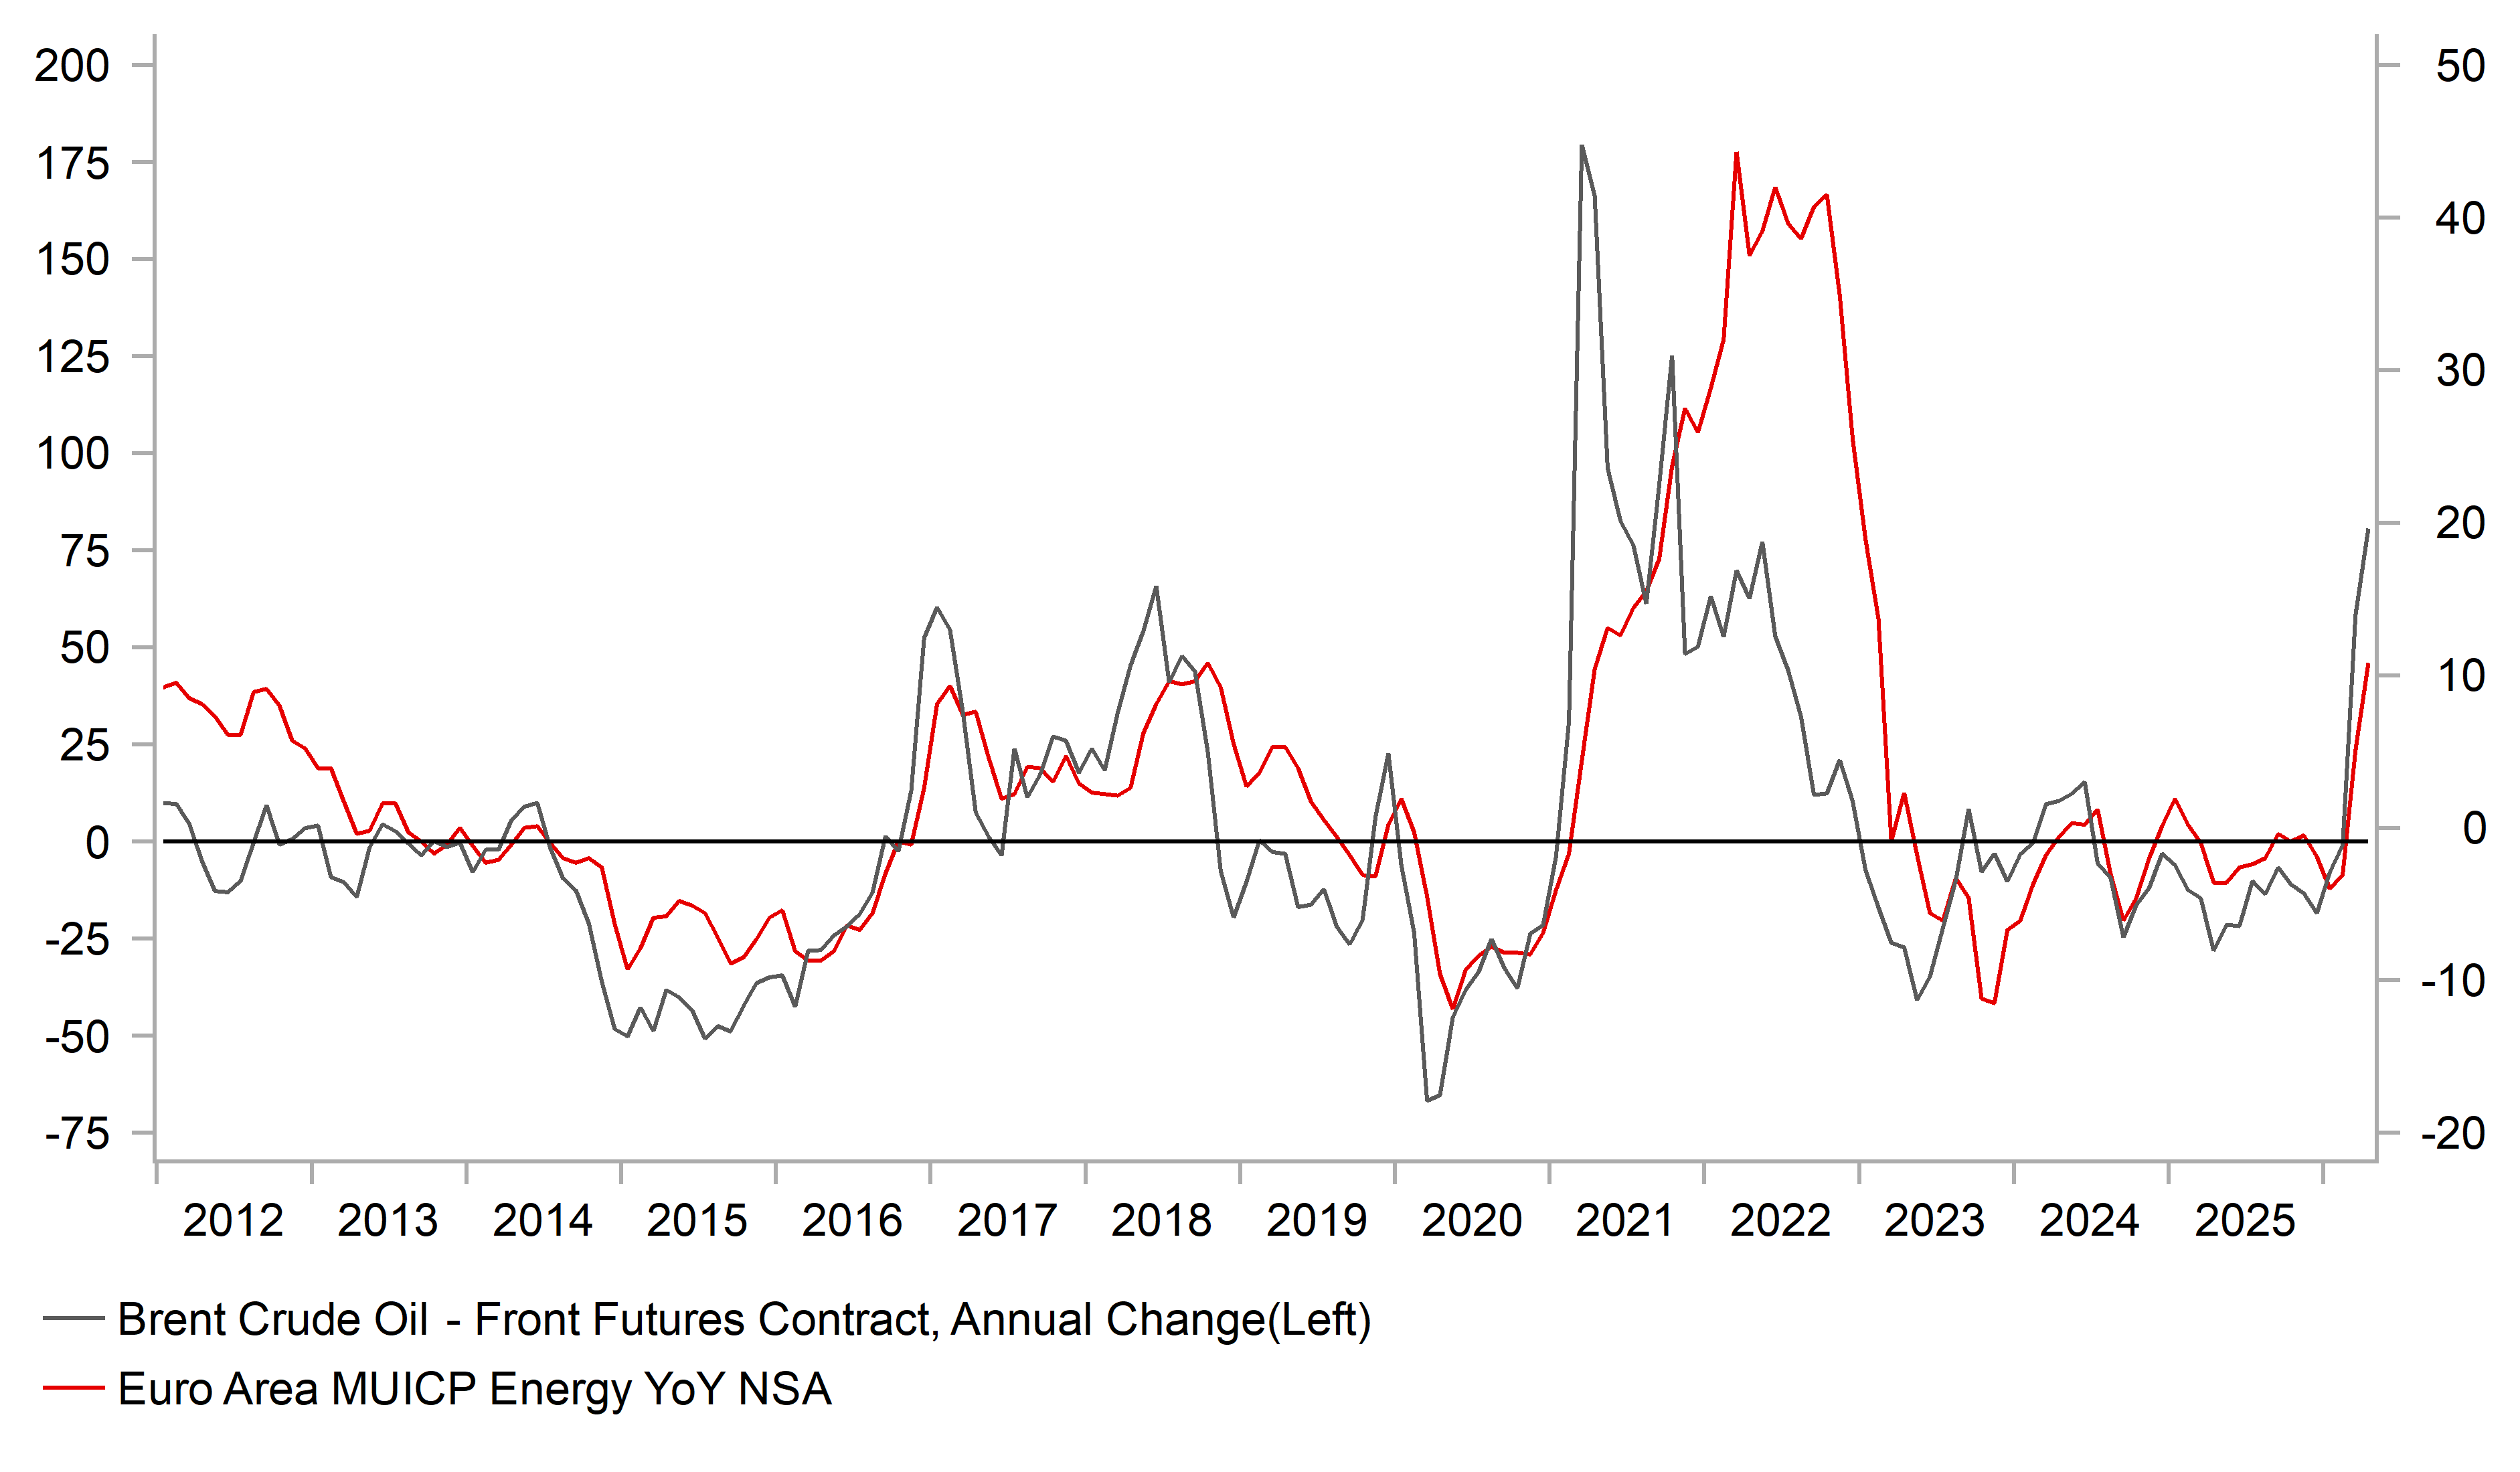
ECB conviction on the need to hike likely stems in part from the ability of Europe so far to cope with a lack of refined fuel imports from the Middle East. Vortexa data indicates that US Gulf Coast exports of diesel/gasoil reached 1.8mb/d in May (to 18th) which is 44% more than the best export month in 2025. Refinery utilisation reach 97%, up 5ppts from a year earlier. Exports to Europe specifically have more than doubled from a year earlier. Kpler data also shows jet fuel deliveries from Africa (Dangote) increased 75% MoM in April with Nigerian cargoes to Europe now 20% of total deliveries versus 4% a year earlier. Physical shortages are still a growing risk, but the imminent threat has receded somewhat, reducing the risk of economic disruption over the summer months.
With ECB tightening now well priced, the upside momentum has faded and given the backdrop of continued uncertainties over the conflict in the Middle East, near-term downside EUR risks remain. However, assuming a deal is finally reached, we see EUR/USD recovery unfolding in the second half of the year.
INTEREST RATE OUTLOOK
Interest Rate Close | Q2 2026 | Q3 2026 | Q4 2026 | Q1 2027 | |
Policy Rate | 2.00% | 2.25% | 2.50% | 2.50% | 2.50% |
3-Month Bill | 2.29% | 2.45% | 2.60% | 2.55% | 2.50% |
10-Year Yield | 2.94% | 3.10% | 3.00% | 2.90% | 2.70% |
* Interest rate assumptions incorporated into MUFG foreign exchange forecasts.
The 10-year German bund yield declined in May, closing 10bps lower at 2.94% although the month-to-month drop masked an initial bigger move higher followed by a sharp move lower, reflecting a drop in energy prices as expectations of a peace deal increased. That deal remains unclear however, and hence the near-term risk is a rertracement back higher in yields. The ECB meeting in June is likely to result in a 25bp rate hike with higher inflation forecasts accompanying the decision. The OIS curve nearly fully reflects this outcome and hence longer-term yields are unlikely to move notably. Any sense of a June rate hike being a one-off would be one catalyst for a sharper move lower in 10-year bund yields than we currently assume. Only one hike seems unlikely to us but there are grounds to believe the tightening required will be modest – President Lagarde has spoken about credibility and survey evidence from the ECB (Survey on the Access to Finance of Enterprises) points to a near-term pick-up in inflation expectations but little change to longer-term expectations. That suggests reduced risk of persistence that should mean a more modest tightening, suggesting longer-term yields can decline.
EUR/USD VS. 10YR SPREAD
Source: : Bloomberg, Macrobond & MUFG GMR
EZ Energy CPI vs. CRUDE
Source:: Bloomberg, Macrobond & MUFG GMR
Pound Sterling
Spot close 29.05.26 | Q2 2026 | Q3 2026 | Q4 2026 | Q1 2027 | |
EUR/GBP | 0.8666 | 0.8700 | 0.8800 | 0.8850 | 0.8850 |
GBP/USD | 1.3481 | 1.3220 | 1.3410 | 1.3560 | 1.3560 |
GBP/JPY | 214.55 | 208.90 | 209.20 | 208.80 | 206.10 |
Consensus | Consensus | Consensus | Consensus | ||
GBP/USD | 1.3400 | 1.3400 | 1.3500 | 1.3600 |
MARKET UPDATE
In May the pound weakened versus the dollar in terms of London closing rates, moving from 1.3578 to 1.3481. In addition, the pound weakened against the euro from 0.8638 to 0.8666. The MPC did not meet in May and hence the key policy rate was unchanged at 3.75%, after six 25bp cuts since August 2024.
OUTLOOK
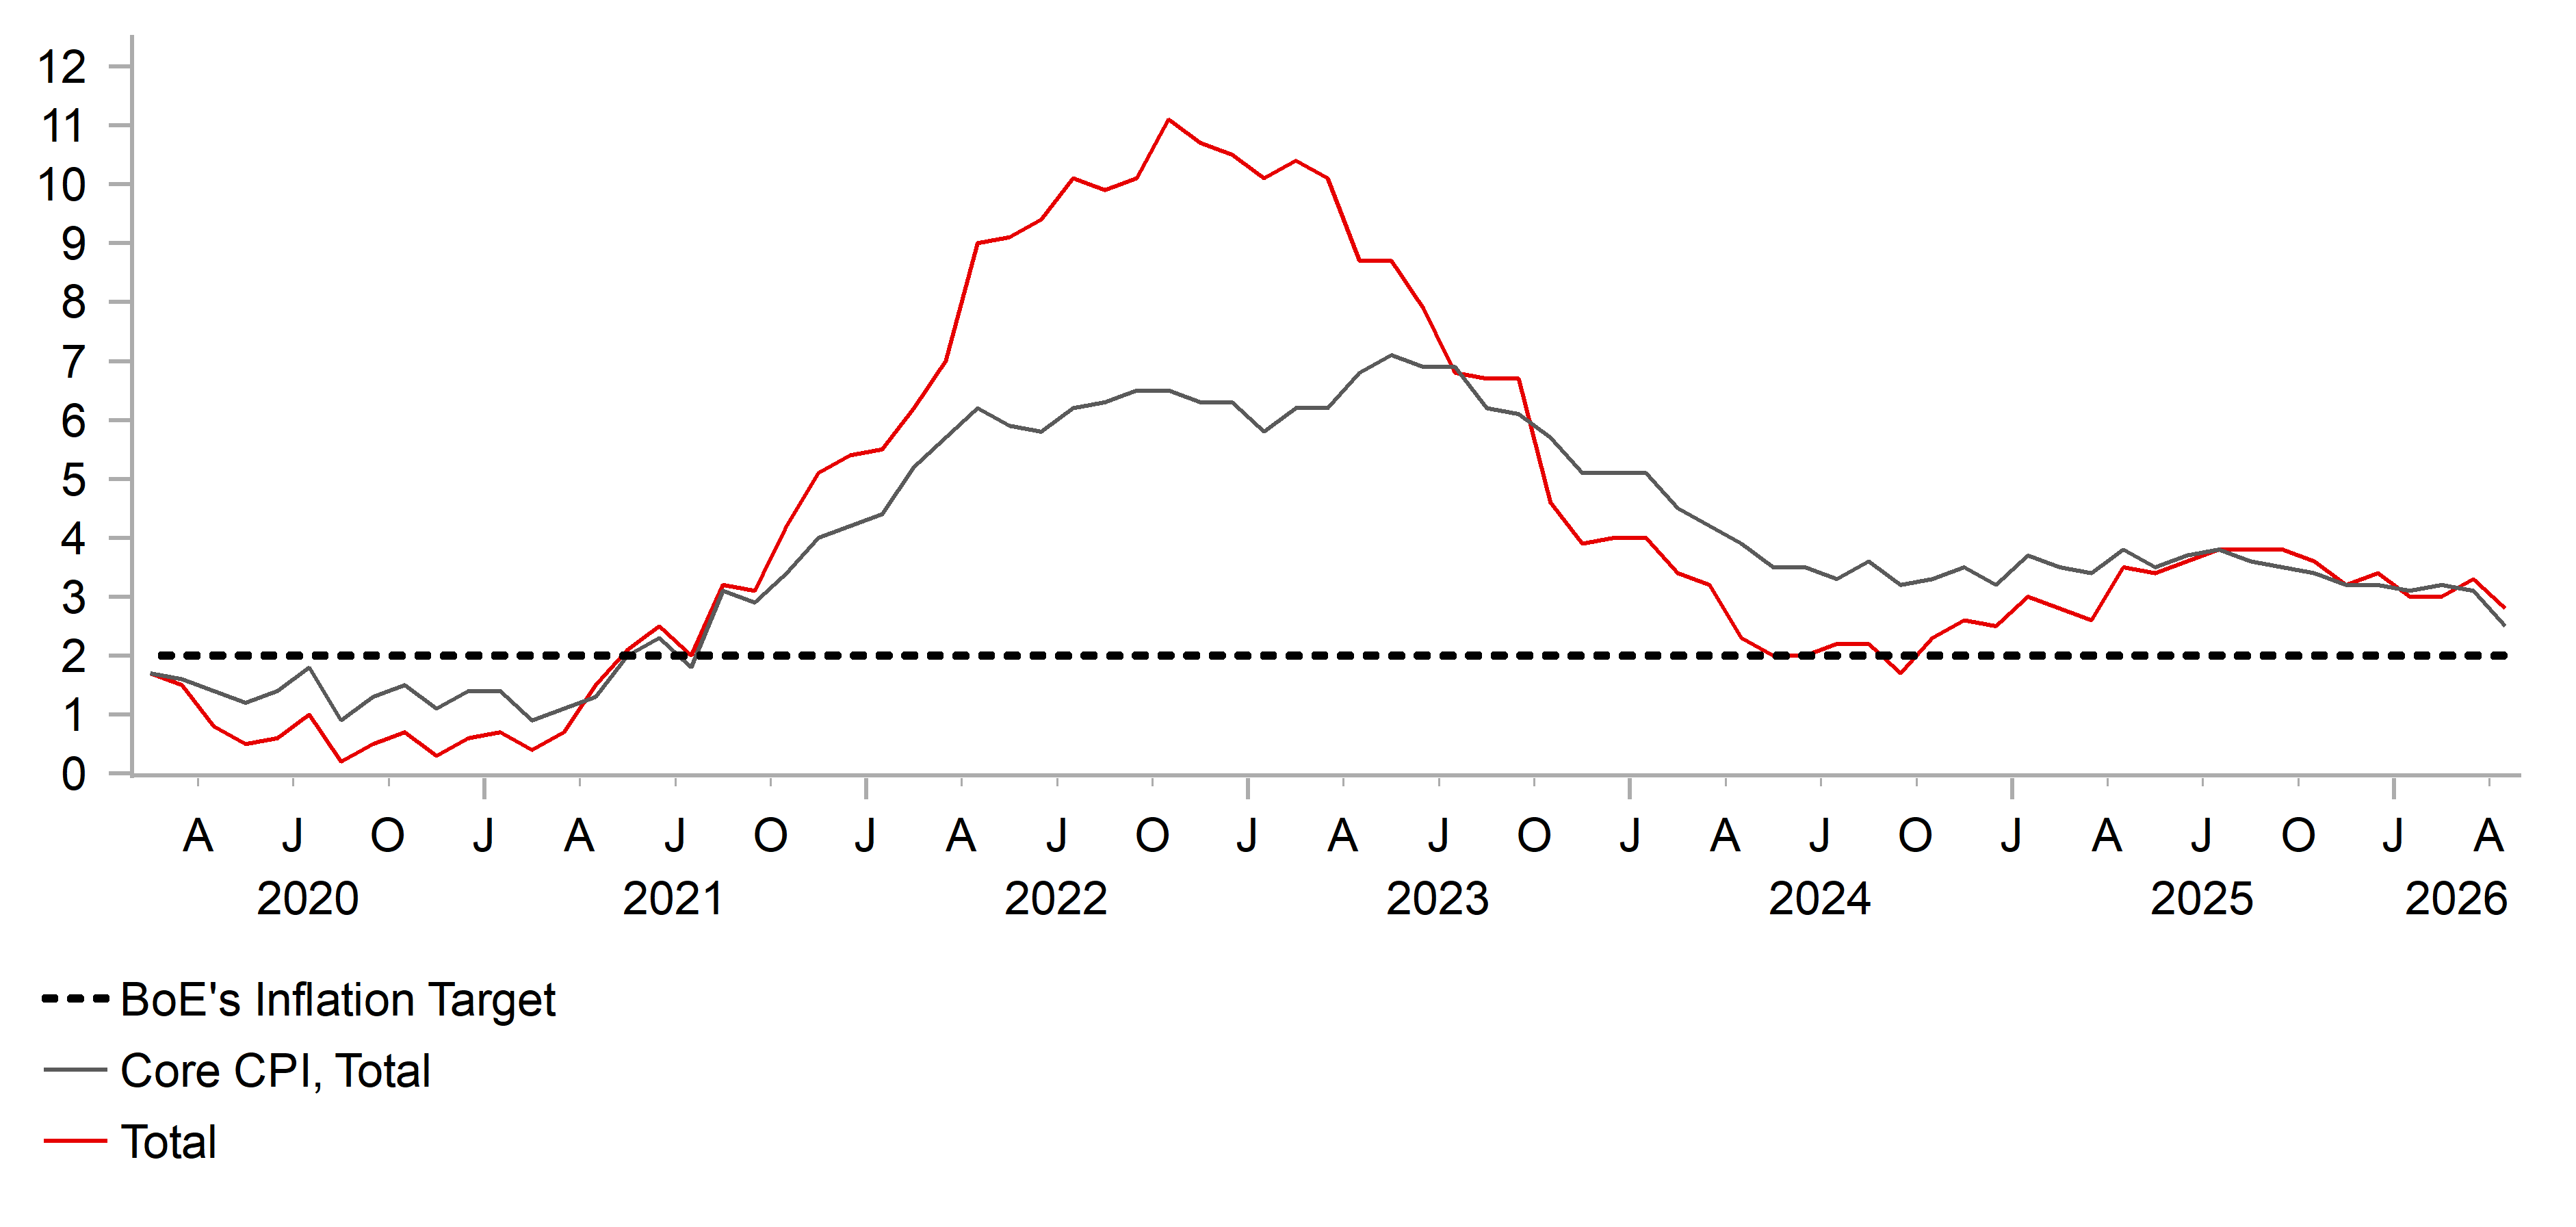
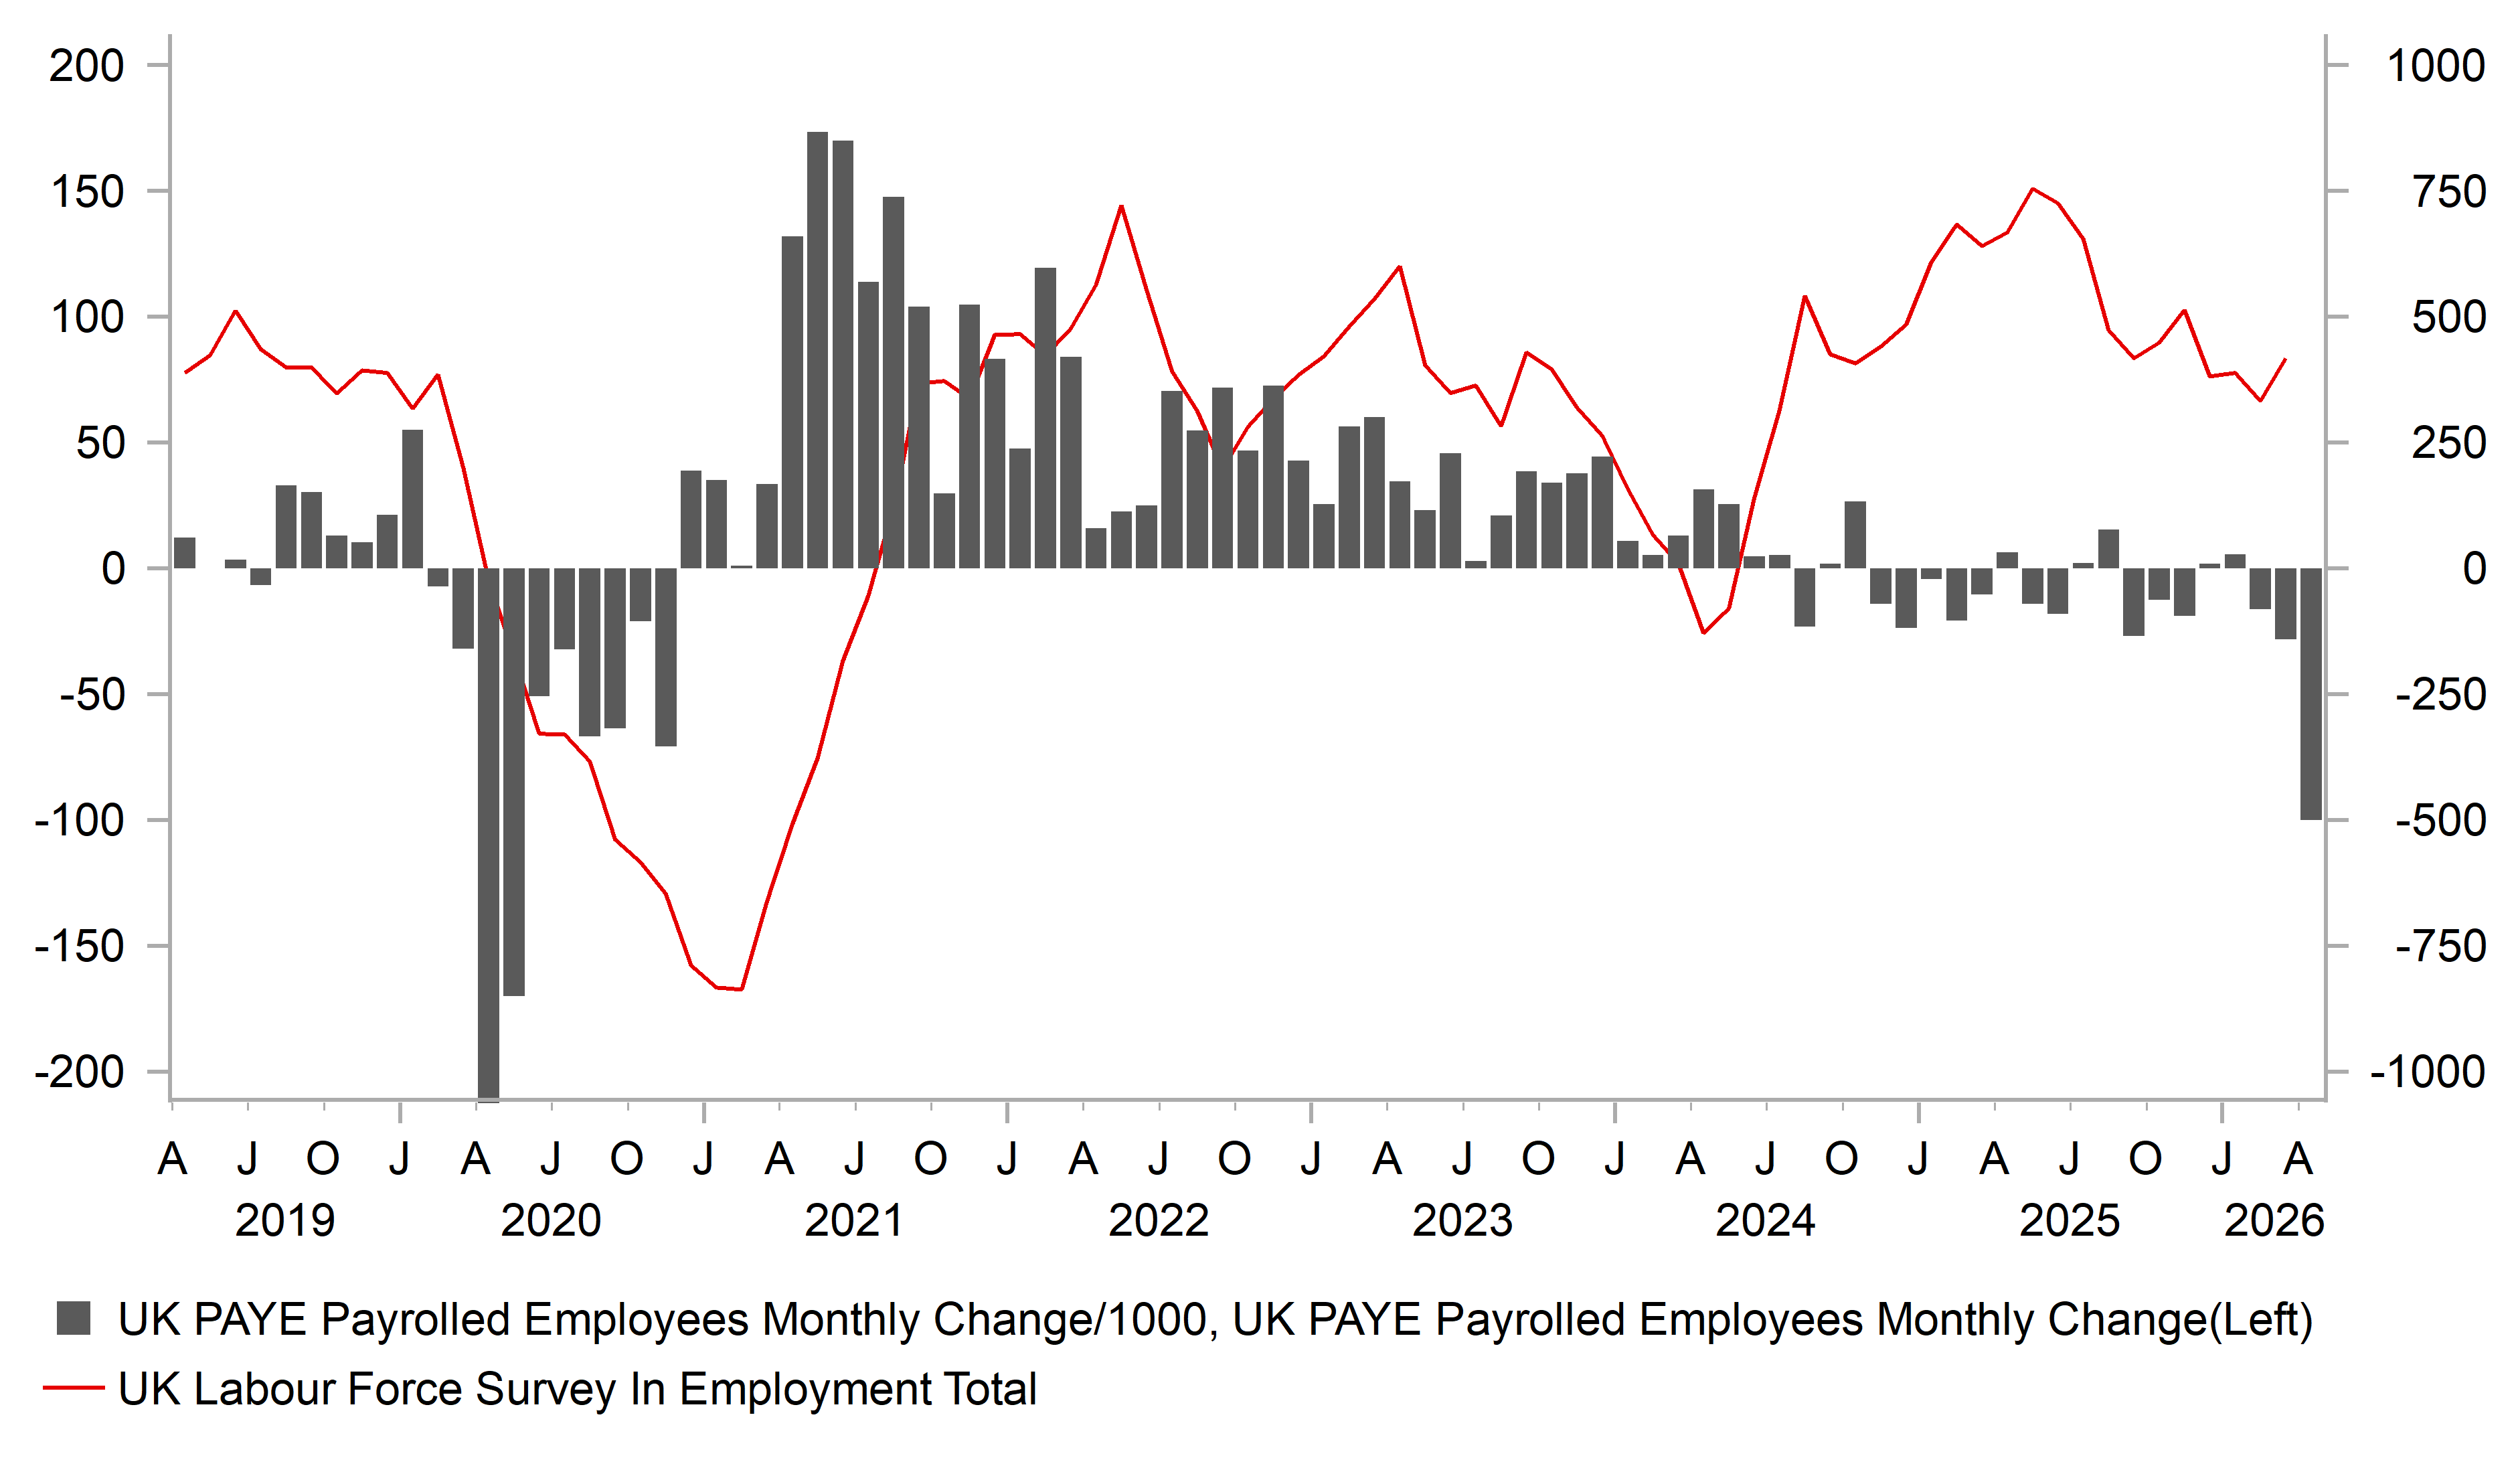
The pound weakened versus both the US dollar and the euro with the sharper drop versus the US dollar reflecting the broader rebound of the dollar. As stated elsewhere, the driver of FX is shifting away from risk and crude oil and back to rate spreads and in that context, it was a driver of the poor performance of the pound, which was the third worst performing G10 currency in May. Expectations of BoE rate hikes fell notably fuelled by several factors – the drop in crude, politics and incoming economic data. The two key data points were weaker than expected – the CPI and jobs data. We have already highlighted elsewhere our view that the weaker CPI data is unlikely to last. A strong base effect, the OFGEM utility price cap timing, and airline fares helped by Easter timing point to less favourable data ahead and we maintain that YoY CPI will move higher in H2 and to hit around 4.0% by year-end. The 100k drop in employment reported for April was much weaker than expected although there is a tendency for the data to be revised notably, in particular in the April month. That said, labour market conditions point to less risk of second-round inflation risks.
The data does still ease the upside inflation risks to some degree although given our view for the inflation outlook, we still expect the BoE to deliver two rate hikes this year, but we have pushed back the timing to July and November from June and July previously. Pushing the timing back also reflects the communication that has been a bit more focused on the tightening of financial conditions that has taken place since the conflict began. With no signs of wage setting behaviour changes and inflation expectations relatively stable, the BoE can afford to wait a little longer.
But hikes still look set to be delivered and the BoE will also not want to be perceived as being behind the curve which would result in renewed Gilt market instability. That risk is also higher given the renewed political uncertainty. If Andy Burnham wins the Makerfield by-election on 18th June he will likely launch a leadership challenge and is likely to win. Gilt yields fell in May in part on Andy Burnham committing to the current self-imposed fiscal rules. However, there is always a risk that Burnham could attempt to bend the rules or implement policies that lack credibility and hence there is a risk of increased fiscal uncertainties that leads to renewed Gilt market underperformance.
The pound is set to weaken over the forecast period versus the euro but strengthen versus the US dollar although we assume, while there may be brief bouts of Gilt market instability, there is no significant upturn in political instability. Rate hikes and a reopening of the Strait of Hormuz will help lift GBP/USD.
INTEREST RATE OUTLOOK
Interest Rate Close | Q2 2026 | Q3 2026 | Q4 2026 | Q1 2027 | |
Policy Rate | 3.75% | 3.75% | 4.00% | 4.25% | 4.25% |
3-Month Bill | 3.88% | 4.10% | 4.35% | 4.30% | 3.95% |
10-Year Yield | 4.81% | 5.00% | 5.00% | 4.80% | 4.50% |
* Interest rate assumptions incorporated into MUFG foreign exchange forecasts.
The 10-year Gilt yield declined notably in May, by 20bps to close at 4.81%. The weak labour market and CPI reports helped fuel a reduction in BoE rate hike expectations and eased inflation concerns. The 5y5y UK inflation swap rate fell around 5bps in May and since the initial move higher after the conflict began has been relatively stable. Only 10bps of tightening is now priced for the BoE meeting on 30th July, which we view as too low. While the CPI report was weaker than expected the points cited above suggest to us that the print is not reflective of inflation risks going forward. Furthermore, the labour market is likely not as weak as implied by the 100k drop which could well be revised. The UK during the 2022-23 inflation shock had to deal with much stickier, domestic generated inflation and while conditions now reduce the extent of domestically generated inflation, the BoE will still likely see the benefits of taking pre-emptive action. An Andy Burnham by-election victory in June followed by becoming PM will bring with it some level of increased fiscal concerns despite his commitment to keep to the fiscal rules and hence we see 10-year Gilt yields remaining elevated before declining later in the forecast period.
CPI – HEADLINE VS. CORE YOY
Source: : Bloomberg, Macrobond & MUFG GMR
UK PAYE PAYROLLED EMPLOYEES VS. UK LABOUR FORCE SURVEY
Source: : Bloomberg, Macrobond & MUFG GMR
Chinese renminbi
Spot close 29.05.26 | Q2 2026 | Q3 2026 | Q4 2026 | Q1 2027 | |
USD/CNY | 6.7658 | 6.7500 | 6.7000 | 6.6500 | 6.6000 |
USD/HKD | 7.8374 | 7.8300 | 7.8200 | 7.8200 | 7.8200 |
Consensus | Consensus | Consensus | Consensus | ||
USD/CNY | 6.8000 | 6.7800 | 6.7300 | 6.7300 | |
USD/HKD | 7.8200 | 7.8000 | 7.8000 | 7.8000 |
MARKET UPDATE
In May, USD/CNY moved from 6.8277 to 6.7658. On 20th May, the PBoC kept the 1Y and 5Y LPR unchanged at 3.00% and 3.50% respectively. While keeping its moderately loose monetary policy stance unchanged in the Q1 Monetary Policy Implementation Report, the PBoC dropped the explicit mention of “RRR and interest rate cuts” and added language on “enhancing monetary–fiscal policy coordination.
OUTLOOK
The negative surprises coming out of China’s April data suggest strong growth headwinds especially in consumption and investment, after the overall economy expanded strongly by 5.0% in Q1. April retail sales grew mildly by 0.2%yoy with a sequential contraction for two consecutive months, clearly showing the fading effectiveness of the goods trade-in program. What is more worrying is the unexpected contraction in FAI by 1.6%yoy for Jan-Apr period, compared to a positive 1.7%yoy growth for Jan-Mar period. While the slowdown was broad based across industries, there was notably a steep growth decline in infrastructure FAI by 4.6ppts to 4.3%yoy YTD despite front-loaded bond issuance this year thus far. Together with the persistent stress in the property market, the overall loan demand contraction in April is indicative of the overall weak domestic demand. The bright spot however rests in the tech sector, which propelled exports growth to 14.1%yoy with hi-tech products contributing 9.3ppts of the growth. While hi-tech manufacturing IP growth also accelerated, overall IP growth unexpectedly slowed to 4.1%yoy dragged by other manufacturing sectors such as petrochemical-related (e.g., chemical, rubber), highlighting the broader weak demand and partially the impact of energy shortages linked to the Iran war. Lastly, April industrial profit YTD growth improved to 18.2%yoy driven by upstream and tech sectors, with downstream sectors still under pressure. Looking ahead, we expect the tech sector to drive growth, but it is unlikely to fully offset the broader growth slowdown especially if the blockade of the SoH remains.
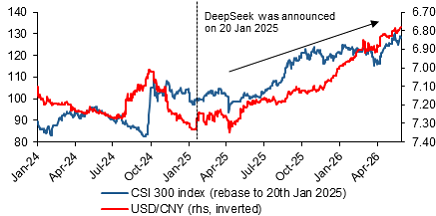
The market decided to look beyond the April data weakness, with CNY appreciation in May reflecting the optimism around China’s rising tech capabilities and a further stabilization of the US-China ties in medium term, among others. For US-China ties, the framework of “constructive strategic stability” as the guardrails likely means a reduced probability of left-tail risk events between both sides such as the tit-for-tat tariff war seen last year. The agreement to establish a US–China Board of Trade and Board of Investment means we would likely see further progress on tariff negotiations and a potential market expansion for investment in “non-sensitive area”. While we remain modestly constructive on CNY given the underlying tech-driven asset revaluation theme, the near-term path for USD/CNY however still hinges on how the war will play out. We may see a mild boost for CNY if the 60-day US-Iran ceasefire agreement is confirmed. Whereas if the Iran war lasts longer, and supply shocks escalate into a severe constraint, the resulting non-linear economic downturn alongside potential capital outflows, would likely cause CNY to depreciate.
INTEREST RATE OUTLOOK
Interest Rate Close | Q2 2026 | Q3 2026 | Q4 2026 | Q1 2027 | |
LPR 1Y | 3.00% | 3.00% | 2.90% | 2.80% | 2.80% |
7-Day Reverse Repo Rate | 1.40% | 1.40% | 1.30% | 1.20% | 1.20% |
10-Year Yield | 1.75% | 1.75% | 1.80% | 1.85% | 1.90% |
* Interest rate assumptions incorporated into MUFG foreign exchange forecasts.
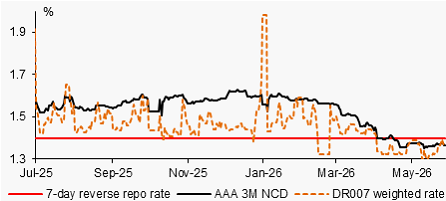
Flush liquidity has persisted into May with the 7-day interbank repo rate (DR007) still trading below the PBoC 7-day reverse repo rate of 1.4%. This condition creates a debate that the PBoC may not cut the key policy rates this year. In fact, the PBoC reportedly still allowed some banks to borrow at rates 5bps lower through its one-year MLF in May. Looking ahead, we think the strengthening of the overall easing bias of monetary policy matters more, whether it is done through lowering money market rates or/and policy rate. Loan demand has been weak especially dragged by the household side, highlighting the muted impact of incremental measures on personal consumption loan subsidy program introduced in January. Weak demand means limited upside for CPI inflation, and creates room for PBoC to ease even if the Iran war persists, as it will generate a non-linear negative growth impact. Bond wise, the ample liquidity conditions pressured the government bond yield curve lower by a few bps in May with the 10-year CGB yield now at 1.75%. We revised the yield forecast levels lower to reflect loose liquidity but still seeing some upside supported by gradual reflation and asset revaluation theme.
ASSET REVALUATION THEME DRIVEN BY TECH ALSO SUPPORTING CNY
Source: : Bloomberg, MUFG GMR
MARKET LIQUIDITY HAS REMAINED AMPLE SINCE APRIL
Source: : Bloomberg, MUFG GMR