Please download PDF from above for the following currencies.
Australian dollar // New Zealand dollar //Canadian dollar // Norwegian krone // Swedish Krona // Swiss franc // Czech koruna // Hungarian forint //Polish zloty // Romanian leu // Russian rouble // South African rand // Turkish lira // Indian rupee // Indonesian rupiah // Malaysian ringgit // Philippine peso //Singapore dollar // South Korean won // Taiwan dollar // Thai baht // Vietnamese dong // Argentine peso // Brazilian real // Chilean peso // Mexican peso // Saudi riyal // Egyptian pound
Monthly Foreign Exchange Outlook
DEREK HALPENNY
Head of Research, Global Markets EMEA and International Securities
Global Markets Research
Global Markets Division for EMEA
E: derek.halpenny@uk.mufg.jp
LEE HARDMAN
Senior Currency Analyst
Global Markets Research
Global Markets Division for EMEA
E: lee.hardman@uk.mufg.jp
LIN LI
Head of Global Markets Research Asia
Global Markets Research
Global Markets Division for Asia
E: lin_li@hk.mufg.jp
KHANG SEK LEE
Associate
Global Markets Research
Global Markets Division for Asia
E: khangsek_lee@hk.mufg.jp
MICHAEL WAN
Senior Currency Analyst
Global Markets Research
Global Markets Division for Asia
E: michael_wan@sg.mufg.jp
LLOYD CHAN
Senior Currency Analyst
Global Markets Research
Global Markets Division for Asia
E: lloyd_chan@sg.mufg.jp
SOOJIN KIM
Analyst, ESG and Emerging Markets Research – EMEA
DIFC Branch – Dubai
E: soojin.kim@ae.mufg.jp
MUFG Bank, Ltd.
A member of MUFG, a global financial group
July 2025
KEY EVENTS IN THE MONTH AHEAD
1) RECIPROCAL TARIFFS & US DOLLAR
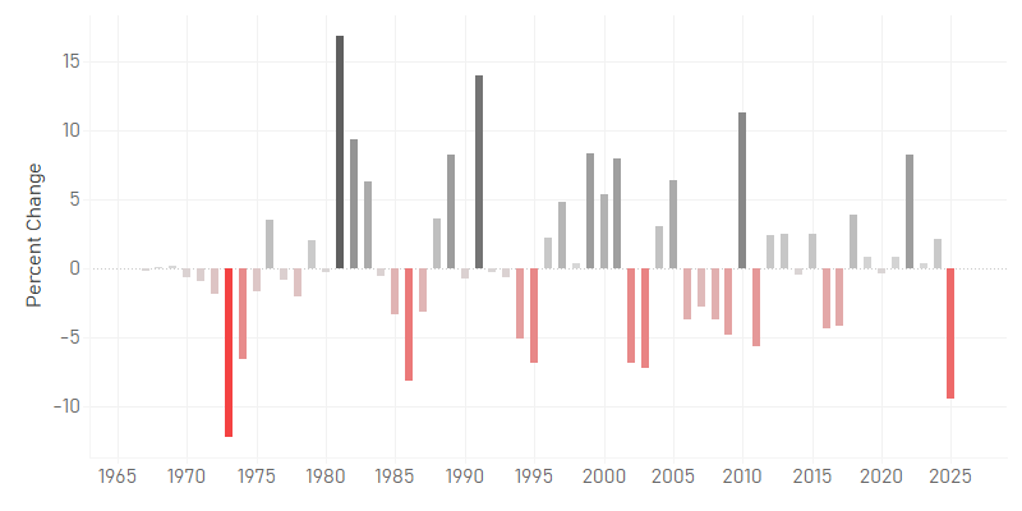
The June closing rates marked the half-way point of the calendar year and the US dollar decline of 10.7% (DXY) was the worst performance for the dollar over the first six months of the calendar year since 1973. The same can be said for President Trump’s first 150 days in office – the drop for the dollar was the largest of any presidential term in the floating exchange rate era back to Richard Nixon. Trump’s erratic trade policies are only part of the reason for the performance. The dollar prior to ‘Liberation Day’ was also at that point the worst performance of the dollar in any presidential term. While we remain US dollar bearish, we also believe the scale of dollar depreciation will be much less in H2 than in H1. We forecast DXY dropping by a further 2.2% by year-end with EUR/USD at 1.2000. In July, the obvious key date to watch is the 9th July – the expiry of the suspension of reciprocal tariffs. There’s a chance this may pass without much volatility if, as suggested by the Trump administration, up to 10 trade deals are signed with key trading partners of the US. There will also be more focus now on the passage of the ‘One Big Beautiful Bill Act’ and how quickly that can be agreed between the House and the Senate. The original target of Trump to sign a deal into law by 4th July will not be met. The removal of Section 899 takes one contentious element out of the bill but it will still likely threaten further the confidence investors have in US debt sustainability.
2) CENTRAL BANK MEETINGS AND SINTRA
Five G10 central banks will meet in July – the RBA (8th July); the RBNZ (9th); the ECB (24th); the FOMC (30th); and the BoJ (31st). We expect the RBA to cut its policy rate by 25bps given the recent weaker inflation and the fact that a 50bp cut was discussed at the last meeting. The other central banks are likely to keep their policy stances on hold although a very weak US jobs report and benign CPI print for June could bring the FOMC into play. The other key central bank event will be the annual gathering hosted by the ECB in Sintra, Portugal running at the very beginning of July. The key panel discussion will be on 1st July and will involve BoE Governor Bailey, Fed Chair Powell, BoJ Governor Ueda and President Lagarde. President Lagarde will give a closing speech on 2nd July.
3) JULY’S CHINA POTLIBURO MEETING
China has confirmed the news of a finalized trade framework with the US, although details are still unknown. We don’t expect the final deal on tariff rates will be much different from the currently implemented 41%, as the focus of negotiations, implied by both sides’ communications, is more about exports restrictions than tariffs specifically. In addition to tariff stress, the Chinese economy faces domestic challenges too and July’s politburo meeting will shed some light on potential stimulus measures ahead.
Forecast rates against the US dollar - End-Q3 2025 to End-Q2 2026
|
Spot close 30.06.25 |
Q3 2025 |
Q4 2025 |
Q1 2026 |
Q2 2026 |
|
|
DXY |
97.067 |
96.490 |
95.060 |
93.530 |
92.680 |
|
JPY |
144.30 |
142.00 |
140.00 |
138.00 |
136.00 |
|
EUR |
1.1746 |
1.1800 |
1.2000 |
1.2200 |
1.2300 |
|
GBP |
1.3702 |
1.3800 |
1.3950 |
1.4100 |
1.4140 |
|
CNY |
7.1637 |
7.2500 |
7.2500 |
7.2300 |
7.2000 |
|
AUD |
0.6557 |
0.6500 |
0.6600 |
0.6700 |
0.6800 |
|
NZD |
0.6077 |
0.6000 |
0.6100 |
0.6200 |
0.6300 |
|
CAD |
1.3634 |
1.3600 |
1.3500 |
1.3300 |
1.3200 |
|
NOK |
10.117 |
10.000 |
9.8330 |
9.5900 |
9.4310 |
|
SEK |
9.5024 |
9.4920 |
9.2500 |
9.0160 |
8.8620 |
|
CHF |
0.7953 |
0.7970 |
0.7920 |
0.7830 |
0.7800 |
|
|
|
|
|
|
|
|
CZK |
21.042 |
20.760 |
20.250 |
19.840 |
19.510 |
|
HUF |
340.17 |
335.60 |
333.30 |
331.10 |
331.70 |
|
PLN |
3.6114 |
3.5590 |
3.5330 |
3.4920 |
3.4800 |
|
RON |
4.3204 |
4.2970 |
4.2420 |
4.1970 |
4.1790 |
|
RUB |
78.130 |
78.630 |
79.820 |
80.980 |
83.370 |
|
ZAR |
17.747 |
17.500 |
17.250 |
17.000 |
17.000 |
|
TRY |
39.808 |
42.000 |
43.750 |
45.500 |
47.000 |
|
|
|
|
|
|
|
|
INR |
85.760 |
85.000 |
84.500 |
84.000 |
84.000 |
|
IDR |
16234 |
15810 |
15650 |
15670 |
15700 |
|
MYR |
4.2060 |
4.1500 |
4.1100 |
4.0800 |
4.0600 |
|
PHP |
56.310 |
56.000 |
55.500 |
55.000 |
55.500 |
|
SGD |
1.2733 |
1.2700 |
1.2600 |
1.2550 |
1.2500 |
|
KRW |
1353.7 |
1370.0 |
1380.0 |
1375.0 |
1365.0 |
|
TWD |
29.222 |
29.800 |
29.800 |
29.650 |
29.500 |
|
THB |
32.474 |
32.800 |
32.500 |
32.400 |
32.300 |
|
VND |
26077 |
26350 |
26300 |
26300 |
26300 |
|
|
|
|
|
|
|
|
ARS |
1191.5 |
1225.0 |
1275.0 |
1325.0 |
1400.0 |
|
BRL |
5.4494 |
5.3000 |
5.3500 |
5.4000 |
5.5000 |
|
CLP |
932.04 |
925.00 |
930.00 |
935.00 |
940.00 |
|
MXN |
18.857 |
18.500 |
18.750 |
19.000 |
19.000 |
|
|
|||||
|
SAR |
64.750 |
60.000 |
58.000 |
57.000 |
59.000 |
|
EGP |
67.570 |
65.000 |
63.000 |
62.000 |
64.000 |
Notes: All FX rates are expressed as units of currency per US dollar bar EUR, GBP, AUD and NZD which are expressed as dollars per unit of currency. Data source spot close; Bloomberg closing rate as of 4:30pm London time, except VND which is local onshore closing rate. All consensus forecasts are Bloomberg sourced.
US dollar
|
Spot close 30.06.25 |
Q3 2025 |
Q4 2025 |
Q1 2026 |
Q2 2026 |
|
|
USD/JPY |
144.30 |
142.00 |
140.00 |
138.00 |
136.00 |
|
EUR/USD |
1.1746 |
1.1800 |
1.2000 |
1.2200 |
1.2300 |
|
Consensus |
Consensus |
Consensus |
Consensus |
||
|
USD/JPY |
142.00 |
140.00 |
139.00 |
138.00 |
|
|
EUR/USD |
1.1500 |
1.1700 |
1.1800 |
1.1800 |
MARKET UPDATE
In June the US dollar weakened further against the euro in terms of London closing rates, from 1.1351 to 1.1746. However, the dollar strengthened modestly against the yen, from 144.10 to 144.30. The FOMC, at its meeting in June, maintained the range for the federal funds rate at 4.25% to 4.50%, the level reached following 100bps of cuts last year. The FOMC is reducing its securities holdings with the pace of QT via the cap of UST bonds allowed to roll off the balance sheet now at just USD 5bn. The pace of reduction in the holdings of MBS is running at around USD 15bn per month.
OUTLOOK
The US dollar weakened notably again and in DXY terms fell 2.5% in June. In June we also passed the 150-day mark of President Trump’s second term in office and the period saw the worst ever performance for the US dollar in all presidential terms in the floating exchange rate era (back to Nixon). In addition, the dollar fell by 10.7% in the first half of 2025 which was the worst first 6mth period of a calendar year on record. Trump’s unpredictable approach to economic policy and the potential harm this could do to the US economy is part of what has driven the dollar weaker. But there are other factors too like the dollar being extremely overvalued (close to Plaza levels from 1985 in REER terms), the end of negative rates in global fixed income markets and Trump’s trade tariffs forcing Europe and China to focus on policies to strengthen domestic demand conditions. The Fed’s Advanced Economy dollar index in real terms remains around 15% above the long-term average covering the period since 1975. There is ample scope for this correction to continue.
Trump’s trade tariff risks to inflation has hindered the Fed’s ability to cut rates and this means the Fed likely has more easing to do than most of the rest of G10 central banks. Commerce Secretary Howard Lutnick’s comments that there could be 10 trade deals signed before the 9th July reciprocal tariff reactivation date (Stephen Miran also mentioned this) makes it much more likely that widespread high tariff rates will not be implemented. That is good news for the global economy and it is good news for the Fed. More modest tariff rates on a smaller number of countries will raise the prospect of CPI being lower than feared and will open up the prospect of the FOMC being more active in cutting rates. July remains plausible if the NFP and CPI data in July prove much weaker than expected. While it can be argued that less trade policy disruption is good for the US as well, we see a cyclical slowdown as still likely given the prolonged period of restrictive monetary policy. Consumers are no longer flush with excess savings and Trump’s economic policies will likely remain erratic and unpredictable thus curtailing business investment and hiring.
Having just seen the largest Jan–Jun dollar depreciation since 1973, we expect H2 selling to be more modest. Given the H1 DXY drop of 10.7%, we assume a more modest 2.2% decline in H2, targeting EUR/USD at 1.2000 by year-end. A larger DXY drop risk may stem from USD/JPY falling below our forecast.
INTEREST RATE OUTLOOK
|
Interest Rate Close |
Q3 2025 |
Q4 2025 |
Q1 2026 |
Q2 2026 |
|
|
Policy Rate |
4.33% |
3.83% |
3.33% |
3.33% |
3.33% |
|
3-Month T-Bill |
4.29% |
3.78% |
3.28% |
3.29% |
3.30% |
|
10-Year Yield |
4.23% |
4.25% |
4.13% |
4.00% |
4.00% |
* Interest rate assumptions incorporated into MUFG foreign exchange forecasts.
We are starting to sound like a broken record, but we maintain our view that the longer the Fed waits, the more they are passively tightening conditions and may need to cut beyond what is priced into the US rates market. We argue the sooner the Fed cuts rates in 2025 and delivers a minimum of 3 cuts of 25 bps (but we think 4 is the right number as it brings the Fed Funds rate to their neutral level) the less cuts they need to do in the early days of 2026. The irony is that the Fed is waiting on potential inflation risks that may never come, or at the very least, may only return at the end of 2026. We think inflation upside will only happen if firms fully pass on tariffs, but more realistically, we think inflation may only return in 2026 due to Trump’s domestic policies and more importantly if US bank lending ahead surges and drives up the money supply. For now a lot of our view hinges on the near-term path for the labor market. If the upcoming jobs data confirms our suspicion that the NFP has been overstated, and about to expose all of the cracks we have been flagging, the Fed will cut in July (which remains our house view) otherwise the next Fed cut will be in September.
(George Goncalves)
% CHANGE IN DXY FROM JANUARY TO JUNE BY YEAR
Source: Bloomberg, Macrobond
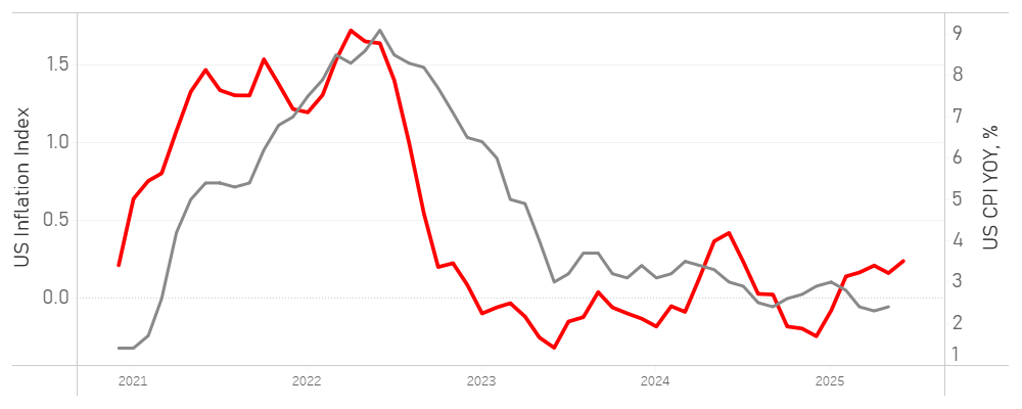
MUFG GMR US INFLATION INDEX VS. OFFICIAL CPI YOY, %
Source: Bloomberg, Macrobond
Japanese yen
|
Spot close 30.06.25 |
Q3 2025 |
Q4 2025 |
Q1 2026 |
Q2 2026 |
|
|
USD/JPY |
144.30 |
142.00 |
140.00 |
138.00 |
136.00 |
|
EUR/JPY |
169.49 |
167.60 |
168.00 |
168.40 |
167.30 |
|
Consensus |
Consensus |
Consensus |
Consensus |
||
|
USD/JPY |
142.00 |
140.00 |
139.00 |
138.00 |
|
|
EUR/JPY |
164.00 |
164.00 |
163.00 |
162.50 |
MARKET UPDATE
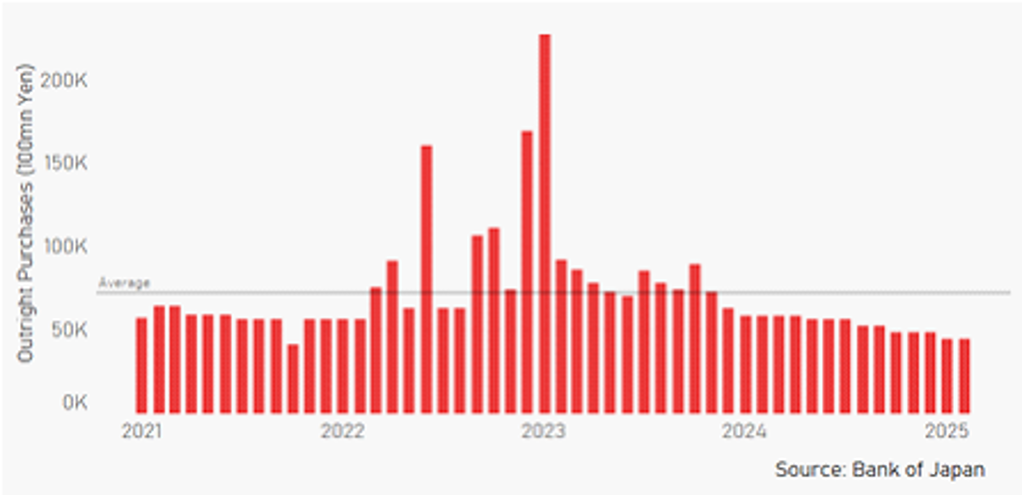
In June the yen weakened versus the US dollar in terms of London closing rates from 144.10 to 144.30. In addition, the yen weakened versus the euro from 163.57 to 169.49. The BoJ at its meeting in June maintained the key policy rate at 0.50%, following the 25bp hike in January, the first 25bp rate hike since before the GFC in 2007. The BoJ is also continuing with the policy of cutting JGB monthly purchases at a pace of JPY 400bn per quarter but announced in June that the pace of reduction will be reduced to JPY 200bn per quarter effective from Q2 2026.
OUTLOOK
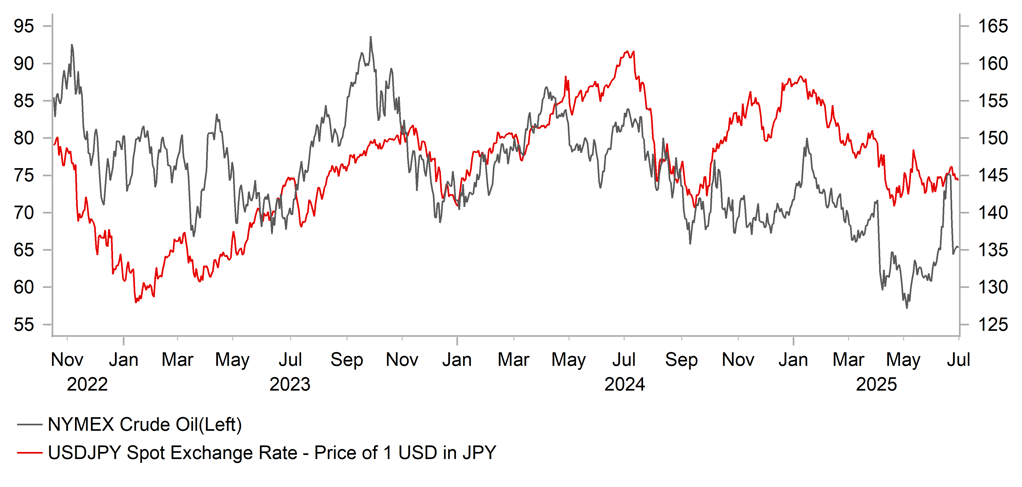
The yen weakened marginally versus the US dollar in June and apart from the dollar was the worst performing G10 currency in June. The yen suffered more than most earlier in June as the Middle East geopolitical risks fuelled a surge in crude oil prices that hit the yen given Japan’s dependency on imported energy. We would assume that if the Middle East remains more stable then this risk premium will shrink helping the yen to catch up and potentially outperform. Besides the geopolitical risk, the outlook for crude oil is quite bearish as was underlined by the IEA monthly report in June. As mentioned here last month, FDI outflows may have also played a role in yen underperformance. The purchase of US Steel Corp by Nippon Steel could have been a supportive factor for USD/JPY in June although there is no way of knowing when and how exactly that flow may go through the FX market. If it has gone through it adds to the scope for the yen to play catch-up and outperform going forward.
The yen may have been negatively hit by the actions to limit upside risks to JGB yields. The BoJ announced at its meeting in June that the pace of QT per quarter would be cut from JPY 400bn per month to JPY 200bn – this had been flagged ahead of the announcement as a possibility. The MoF also cut the issuance of super-long JGBs that should help reduce upside yield risks. However, we see rates at the front-end of the curve as being more important and issuance at the front-end will increase in the updated MoF plans while the BoJ is likely to turn more hawkish and potentially could be in a position to hike rates again by September. The US tariff plans will be important but there is a good chance that Japan will reach a deal with the US to avoid the reciprocal tariff and possibly to reduce the auto tariff to the baseline 10%, subject to a quota. Inflation remains high and food inflation in particular could influence inflation expectations. Shunto wage negotiations mean another year of strong wage growth and the continued weakness of the yen will likely encourage a more hawkish approach by the BoJ. The US will likely be expecting such an approach given their complaints over the BoJ policy impact on the yen.
Divergence in monetary policy should become more apparent in H2 with the Fed restarting its easing cycle and still high inflation in Japan prompting BoJ monetary tightening. Reciprocal tariffs hitting Japan would curtail BoJ action but not Fed action and hence we still see scope for yen gains from still very undervalued levels.
INTEREST RATE OUTLOOK
|
Interest Rate Close |
Q3 2025 |
Q4 2025 |
Q1 2026 |
Q2 2026 |
|
|
Policy Rate |
0.50% |
0.50% |
0.75% |
0.75% |
1.00% |
|
3-Month Bill |
0.43% |
0.50% |
0.70% |
0.80% |
0.90% |
|
10-Year Yield |
1.43% |
1.50% |
1.60% |
1.70% |
1.80% |
* Interest rate assumptions incorporated into MUFG foreign exchange forecasts.
The 10-year JGB yield declined in June, by 7bps to close at 1.43%. The drop followed a sharp rise in May when there were signs of increased investor concerns over debt sustainability and supply-demand imbalances. This was adressed through the BoJ QT pace being cut by 50% to JPY 200bn worth of JGB purchases per month per quarter. The MoF also shifted issuance to shorter maturities to help the long-end. Risks will remain and renewed UST bond instability would have knock-on effects on JGBs as well. We also have seen foreign investors return to the JGB market in June with weekly data showing foreign investor buying in three of the last four weeks so sentiment has improved. There is only currently 5bps of tightening priced for the September meeting and given the inflation data in June surpirsed to the upside, we believe the markets are under-estimating the risks. A credible strategy for helping stabilise longer-term yields would be modest monetary tightening to enhance inflation credibility and help to strengthen the yen. We continue to expect a moderate increase in 10-year JGB yields over the forecast period.
USD/JPY VS. CRUDE OIL
Source: Bloomberg, Macrobond
BOJ OUTRIGHT PURCHASES OF JGBS
Euro
|
Spot close 30.06.25 |
Q3 2025 |
Q4 2025 |
Q1 2026 |
Q2 2026 |
|
|
EUR/USD |
1.1746 |
1.1800 |
1.2000 |
1.2200 |
1.2300 |
|
EUR/JPY |
169.49 |
167.60 |
168.00 |
168.40 |
167.30 |
|
Consensus |
Consensus |
Consensus |
Consensus |
||
|
EUR/USD |
1.1500 |
1.1700 |
1.1800 |
1.1800 |
|
|
EUR/JPY |
164.00 |
164.00 |
163.00 |
162.50 |
MARKET UPDATE
In June the euro strengthened marginally versus the US dollar in terms of London closing rates, moving from 1.1351 to 1.1746. The ECB, at its meeting in June cut the key policy rate by 25bps to 2.00%, following 175bp of cuts since last year. The ECB is running down APP securities and started PEPP run-off in July last year with about EUR 425bn of securities estimated to roll off the balance sheet in 2025.
OUTLOOK
After a month of consolidation in May the euro broke further higher in June hitting a high versus the US dollar not seen since September 2021, well before the Russian invasion of Ukraine that triggered a major move lower. The euro was in fact the number one performing G10 currency in June with some developments reinforcing confidence amongst investors that Europe can manage with further currency strength. The German IFO Business Climate Index, the Composite PMI and the ZEW Expectations index all increased in data released in June underlining increased optimism linked to Germany’s fiscal expansion plans that will see both infrastructure and defence spending increase notably. The NATO summit in June also resulted in an agreement for countries to reach a defence spending target of 5% of GDP by 2035 which will also likely benefit German companies more given the greater weighting in manufacturing toward defence compared to other countries. ECB President Lagarde at the policy meeting in June repeated her comments made in May that there was an opportunity for the euro to increase its role as a reserve currency highlighting the openness of the authorities to further currency appreciation.
We have raised our EUR/USD forecasts by two to three big figures (previous Q3; Q4; Q1 2026 1.1500; 1.1800; 1.2000) reflecting the unanticipated speed of the move higher to this point and the still relatively conservative pricing for Fed rate cuts through H2 compared to our expectations. We have maintained our view that the ECB will cut on two further occasions this year based on the assumption that the US will introduce a 20% reciprocal tariff on the EU. The communication from President Lagarde was certainly consistent with the ECB ending its back-to-back pace of cuts and moving to a quarterly pace. If the reciprocal tariff plans prove less than expected for the EU or globally, the ECB may be more cautious in cutting. ECB officials have been clear that they believe the job of bringing inflation back under control has been achieved and to cut further would reflect risks to the downside for inflation. A credible inflation targeting track record and a AAA sovereign credit at the heart of Europe could well prove attractive for global investors seeking to diversify away from the US and ECB bond flow data does show a stable, notable inflow from abroad.
Given the EUR gains and seeing limited risk for any notable correction lower, we see the 1.2000-level now as very achievable later this year. The euro remains the anti-dollar and small shifts in portfolio flows or hedging to reduce US dollar exposure will inevitably be to the benefit of Europe and the euro.
INTEREST RATE OUTLOOK
|
Interest Rate Close |
Q3 2025 |
Q4 2025 |
Q1 2026 |
Q2 2026 |
|
|
Policy Rate |
2.00% |
1.75% |
1.50% |
1.50% |
1.50% |
|
3-Month Bill |
1.96% |
1.70% |
1.50% |
1.55% |
1.55% |
|
10-Year Yield |
2.61% |
2.40% |
2.50% |
2.55% |
2.65% |
* Interest rate assumptions incorporated into MUFG foreign exchange forecasts.
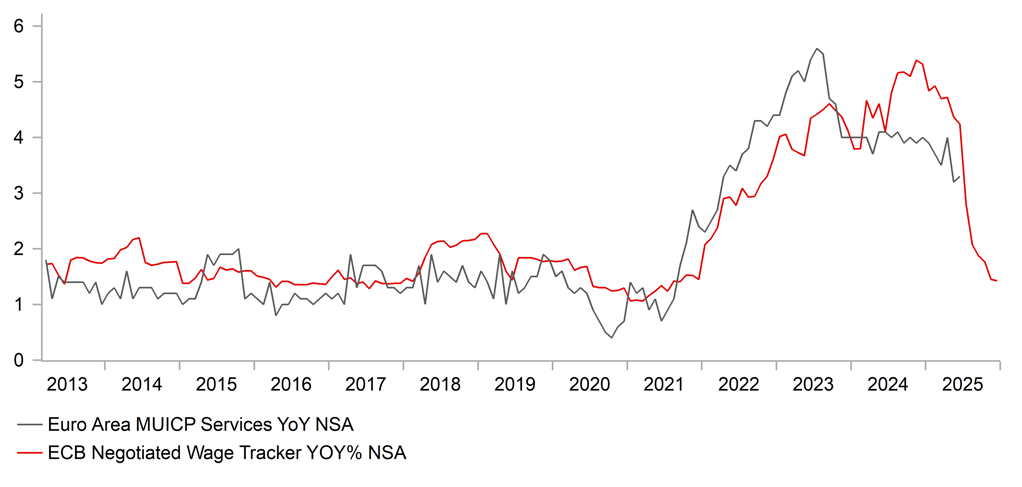
The 10-year bund yield increased again, by 11bps to close at 2.61%. With the ECB policy rate now at the widely deemed neutral rate, the 10-year yield is likely to reflect that more by trading in narrower ranges going forward. Of course a sudden risk-off shock will fuel volatility but the euro-zone economy is now on a better footing with fiscal policy set to expand notably in Germany. With Germany having ample capacity for fiscal loosening, the impact has been modest with the 10-year yield trading mostly in a 2.40%-2.60% range, the same range as in January and February before the German fiscal announcement that saw the 10-year yield surge through the 2.80% level. We also suspect that low inflation will act to counter fiscal-related upside pressures on yields. The negotiated wage annual growth tracker for the euro-zone has plunged from over 5% at the end of last year to signal a year-end rate for this year of just 1.425%. The scale of euro appreciation will also add to disinflationary pressures that will help limit upside yield pressures on fiscal expansion. The ECB’s EUR TWI is up nearly 6% year-to-date. We see the 10-year German bund yield trading only modestly lower and remaining in a relatively narrow range.
EUR/USD VS. 10YR YIELD SPREAD

Source: Bloomberg, Macrobond
NEGOTIATED WAGES VS. SERVICES CPI YOY, %
Source: Bloomberg, Macrobond
Pound Sterling
|
Spot close 30.06.25 |
Q3 2025 |
Q4 2025 |
Q1 2026 |
Q2 2026 |
|
|
EUR/GBP |
0.8572 |
0.8550 |
0.8600 |
0.8650 |
0.8700 |
|
GBP/USD |
1.3702 |
1.3800 |
1.3950 |
1.4100 |
1.4140 |
|
GBP/JPY |
197.72 |
196.00 |
195.30 |
194.60 |
192.30 |
|
Consensus |
Consensus |
Consensus |
Consensus |
||
|
GBP/USD |
1.3500 |
1.3600 |
1.3700 |
1.3800 |
MARKET UPDATE
In June the pound strengthened further against the US dollar in terms of London closing rates from 1.3477 to 1.3702. However, the pound weakened against the euro from 0.8422 to 0.8572. The MPC, at its meeting in June, kept the key policy rate unchanged at 4.25% which followed four 25bp cuts since August last year.
OUTLOOK
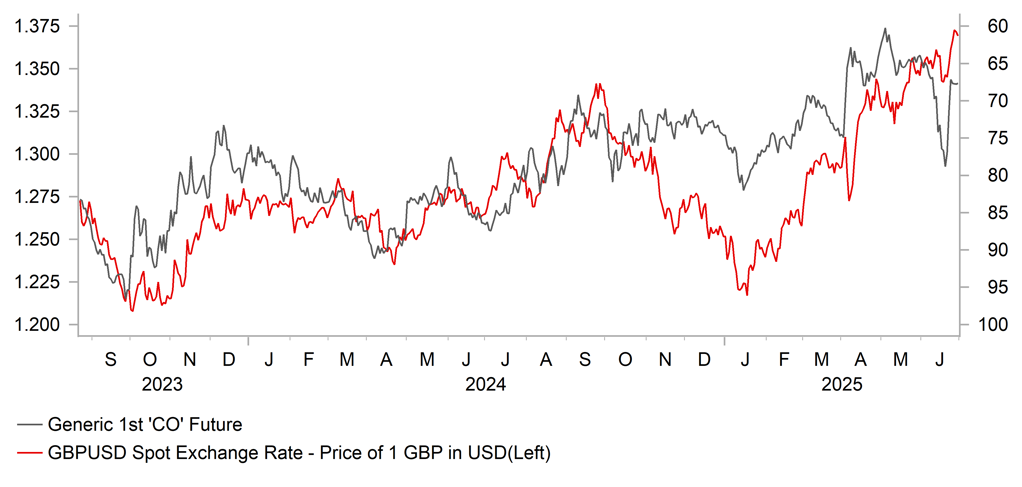
For much of June the pound lagged in performance versus G10 but then went from one of the worst performing currencies to finish June the third best performing currency. The turnaround coincided with the shift in risk conditions following the ceasefire between Israel and Iran. While there was no big risk-off move given equities remain well underpinned, inflation risks jumped following the surge in crude oil prices. The UK, more than most, is more vulnerable to day-to-day energy market moves (in particular natural gas) due to limited storage capacity and the surge in energy prices was a bigger negative risk for the UK. The ceasefire and the 15% plunge in crude oil prices helped lower natural gas prices and the outlook if geopolitics stabilises is bearish for oil, as was underlined by the IEA in its monthly report. An external shock is not what the UK needs given the signs of a weakening labour market. The PAYE jobs data revealed a 109k drop in employment. The PMI Composite data for Q2 (49.83) was lower than in Q1 (50.86) when real GDP growth expanded by 0.7% Q/Q pointing to that being a one-off. Real GDP is expected to slow back to 0.2% or possibly even 0.1% Q/Q in Q2.
Weak underlying growth could well at some stage prompt a shift in the MPC’s “gradual and careful” approach to monetary easing – which is seen as implying one cut per quarter. The MPC vote of 6-3 highlights a risk bias to cut faster and the statement cited the potential for labour market slack to open up and help moderate wage growth going forward. The MPC added that it would remain “vigilant” about Middle East developments but with that inflation risk fading it certainly would help the case for a faster pace of cuts although that will be determined more from domestic factors, and most specifically pay growth. Hence, if the PAYE jobs data was to confirm a softer labour market with further job losses and energy prices were to remain under control with better Middle East conditions, we could well see a faster pace of cuts emerge later in the year. We also are likely to see the BoE announce a slowing of the pace of QT. Governor Bailey in June stated that the QT decision would be “more interesting” this year and that pervious debt market conditions and sell-offs would be factors taken into account when reviewed. A decision will be announced at the September MPC meeting.
Pound gains versus the dollar but depreciation versus the euro remains the view. Relative to last month we see increased risks that the MPC could go back-to-back with cuts in August and September if labour market data remains weak. That points to downside risks for GBP relative to our forecasts.
INTEREST RATE OUTLOOK
|
Interest Rate Close |
Q3 2025 |
Q4 2025 |
Q1 2026 |
Q2 2026 |
|
|
Policy Rate |
4.25% |
4.00% |
3.75% |
3.50% |
3.50% |
|
3-Month Bill |
4.24% |
3.95% |
3.70% |
3.45% |
3.50% |
|
10-Year Yield |
4.49% |
4.40% |
4.20% |
4.30% |
4.30% |
* Interest rate assumptions incorporated into MUFG foreign exchange forecasts.
The 10-year Gilt yield declined in June, by 16bps to close at 4.49%. The big move in June came on the day of the release of the labour market data and the 109k drop in employment reported from PAYE tax data provided the strongest indication yet that the UK labour market is weakening. The data also revealed a sharper slowdown in wage growth and the data led the MPC to conclude that “slack was opening up” in the jobs market that should see wage growth slow. Easing geopolitical risks and a sharp reversal in natural gas prices will help ease concerns over upside risks to inflation. We will need to see continued weak labour market data for upside inflation risks to ease enough to allow for back-to-back rate cuts – this is certainly becoming a bigger risk. Governor Bailey has also signalled the scope for a cut to the pace of QT from the current GBP 100bn per year which is likely now being priced and helping limit upside momentum in yields. With a trade deal in place with the US, reciprocal tariffs being implemented would likely be seen by the UK as a negative global demand shock that would potentially add to the chances of a pick-up in the pace of easing. We maintain our view of modestly lower 10-year Gilt yields.
GBP/USD VS. CRUDE OIL FUTURES (INVERTED)
Source: Bloomberg, Macrobond
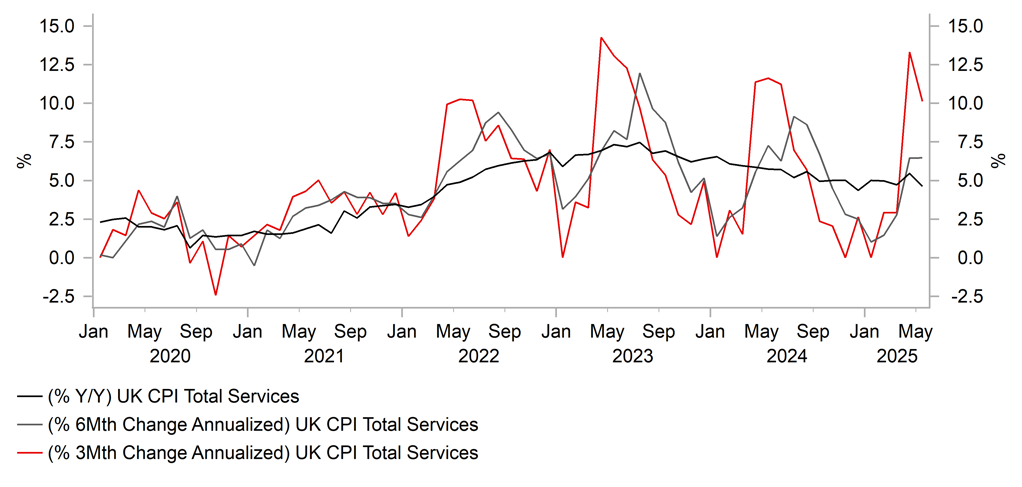
UK CPI SERVICES YOY, %
Source: Bloomberg, Macrobond
Chinese renminbi
|
Spot close 30.06.25 |
Q3 2025 |
Q4 2025 |
Q1 2026 |
Q2 2026 |
|
|
USD/CNY |
7.1637 |
7.2500 |
7.2500 |
7.2300 |
7.2000 |
|
USD/HKD |
7.8499 |
7.8400 |
7.8400 |
7.8400 |
7.8400 |
|
Consensus |
Consensus |
Consensus |
Consensus |
||
|
USD/CNY |
7.2000 |
7.1900 |
7.1900 |
7.1300 |
|
|
USD/HKD |
7.8000 |
7.8000 |
7.8000 |
7.8000 |
MARKET UPDATE
In June, USD/CNY moved from 7.1975 to 7.1637. On 20th June, the PBoC kept the 1Y and 5Y LPR at 3.00% and 3.50% respectively, after lowering them by 10bps in the prior month.
OUTLOOK
The release of May’s economic data pointed to slowing economic growth dragged lower by an underwhelming housing sector and decelerating growth in manufacturing FAI and infrastructure FAI. That said, the government’s trade-in programs helped to support stronger-than-expected retail sales growth in May, though seasonal factors and an earlier promotion of the “618” shopping festival may have also played a role. Looking ahead, the government would likely continue to focus on boosting consumption, as well as giving more attention to the housing sector. For the former, the NDRC confirmed that the third batch of funds for the consumer goods trade-in program will be dispatched in July after allocating RMB 81bn each in January and April, providing a well-paced dispatchment to sustain retail sales growth momentum. While the entire annual fund of RMB 300bn is expected to only be used up by year-end as planned, a mild top-up is possible as external downward pressure intensifies in 2H. Meanwhile, six state organizations including the PBoC jointly issued guidelines on 24th June to step up financial support to boost consumption with 19 measures from 6 aspects, among which is to encourage financial institutions to extend loans to the services consumption sector through structural policy tools. In addition, we think the government will roll out additional measures to stabilize the housing market, as it matters for consumer sentiment and their willingness to spend.
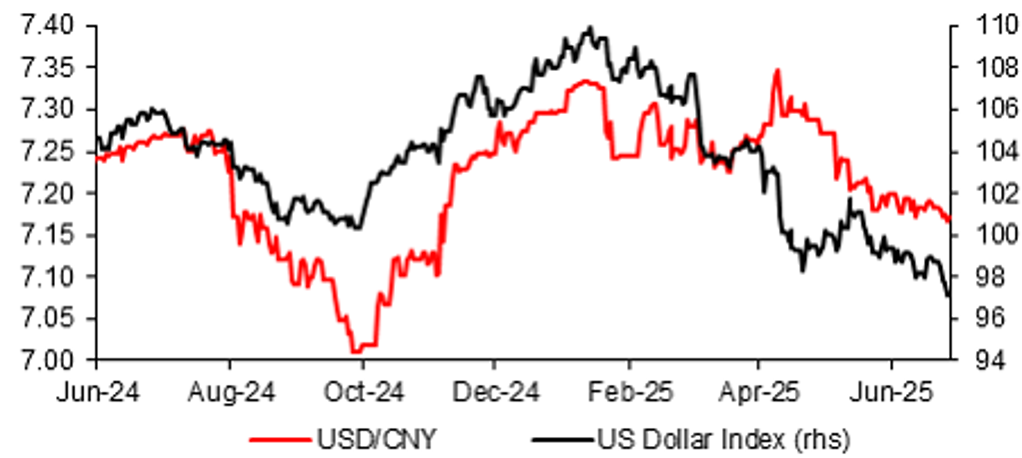
Our call for a mild increase of USD/CNY largely rests on a weaker growth outlook for China’s economy. We expect a growth slowdown from 5.4% in Q1 to 4.2-4.3% in Q4 putting downward pressure on the CNY albeit partly offset by broad-based US dollar weakness. Our FX forecast considers a potential final tariff imposed by US on its imports from China not much different from current 41%. Recently, Howard Lutnick told Bloomberg that China is going to deliver rare earths to US and once China did that, “we’ll take down our countermeasures”. We think that the focus of tariff talks between US and China may be more on exports and investment/technology restrictions, rather than tariff rates. China’s Ministry of Commerce confirmed the news of a finalized trade framework with the US on 27th June, with China to review and approve eligible exports application of controlled-items and US to correspondingly cancel a series of restrictive measures on China. We are aware of the mild strengthening of CNY recently, but it was mainly driven by external factors and with minimal pricing-in of the domestic stress ahead, in our view. The PBoC’s lower USD/CNY fixing recently is likely reflective of the weaker US dollar trend, not shifting of preference for a stronger CNY. A potential PBoC rate cut and weaker exports in Q3 and H2 due to dissipating front-running exports are set to weigh more on the CNY.
INTEREST RATE OUTLOOK
|
Interest Rate Close |
Q3 2025 |
Q4 2025 |
Q1 2026 |
Q2 2026 |
|
|
LPR 1Y |
3.00% |
2.80% |
2.60% |
2.60% |
2.60% |
|
7-Day Repo Rate |
1.40% |
1.20% |
1.00% |
1.00% |
1.00% |
|
10-Year Yield |
1.65% |
1.55% |
1.55% |
1.65% |
1.75% |
* Interest rate assumptions incorporated into MUFG foreign exchange forecasts.
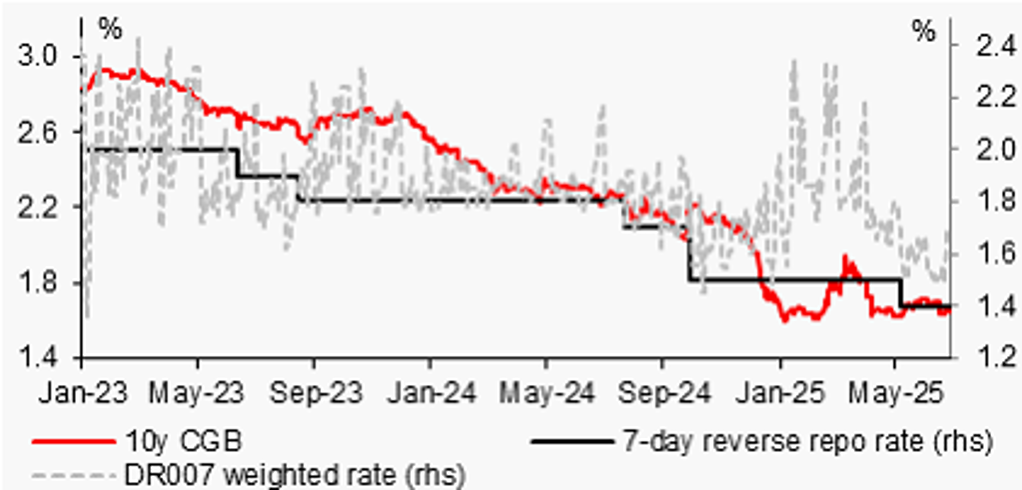
The 10-year CGB yield edged lower by 6bps to 1.65% in June. We expect it to remain low in Q3 and possibly edge lower. Current real interest rates are at elevated levels due to deflation. Elevated real interest rates are not conducive to the release of consumer demand too. This deflationary environment and a challenging growth prospect require the PBoC to deliver more rate cuts, to reduce the real cost of funding in the economy. We expect the PBoC to further cut the 7-day reverse repo rate by 20bps in Q3 and Q4 respectively, and to further cut reserve the requirement ratio in the second half of the year. Historical experiences indicate that fundamentals are the core factor that determines bond performance. Looking forward, weak overall economic fundamentals (decelerating economic growth in H2) and overall loose liquidity conditions to jointly support a the bond market. Additionally, as global geopolitical risks and the risk between US and China remain high, these would imply that risk-free assets are still the favoured assets. China’s bond yields will likely trend down in Q3. China’s 10-year Treasury bond yield may fall to 1.55% or even lower temporarily.
USD/CNY PAIR IS TRACKING A LOWER DXY INDEX LATELY
Source: : Bloomberg, MUFG GMR
FURTHER RATE CUTS WOULD BRING 10-YEAR CGB YIELD LOWER
Source: : Bloomberg, MUFG GMR
