

Please download PDF from above for the following currencies.
Australian dollar // New Zealand dollar //Canadian dollar // Norwegian krone // Swedish Krona // Swiss franc // Czech koruna // Hungarian forint //Polish zloty // Romanian leu // Russian rouble // South African rand // Turkish lira // Indian rupee // Indonesian rupiah // Malaysian ringgit // Philippine peso //Singapore dollar // South Korean won // Taiwan dollar // Thai baht // Vietnamese dong // Argentine peso // Brazilian real // Chilean peso // Mexican peso // Saudi riyal // Egyptian pound
Monthly Foreign Exchange Outlook
DEREK HALPENNY
Head of Research, Global Markets EMEA and International Securities
Global Markets Research
Global Markets Division for EMEA
E: derek.halpenny@uk.mufg.jp
LEE HARDMAN
Senior Currency Analyst
Global Markets Research
Global Markets Division for EMEA
E: lee.hardman@uk.mufg.jp
LIN LI
Head of Global Markets Research Asia
Global Markets Research
Global Markets Division for Asia
E: lin_li@hk.mufg.jp
KHANG SEK LEE
Associate
Global Markets Research
Global Markets Division for Asia
E: khangsek_lee@hk.mufg.jp
MICHAEL WAN
Senior Currency Analyst
Global Markets Research
Global Markets Division for Asia
E: michael_wan@sg.mufg.jp
LLOYD CHAN
Senior Currency Analyst
Global Markets Research
Global Markets Division for Asia
E: lloyd_chan@sg.mufg.jp
SOOJIN KIM
Analyst, ESG and Emerging Markets Research – EMEA
DIFC Branch – Dubai
E: soojin.kim@ae.mufg.jp
MUFG Bank, Ltd.
A member of MUFG, a global financial group
August 2026
KEY EVENTS IN THE MONTH AHEAD
1) FROM CEASEFIRE TO RE-ESCALATION
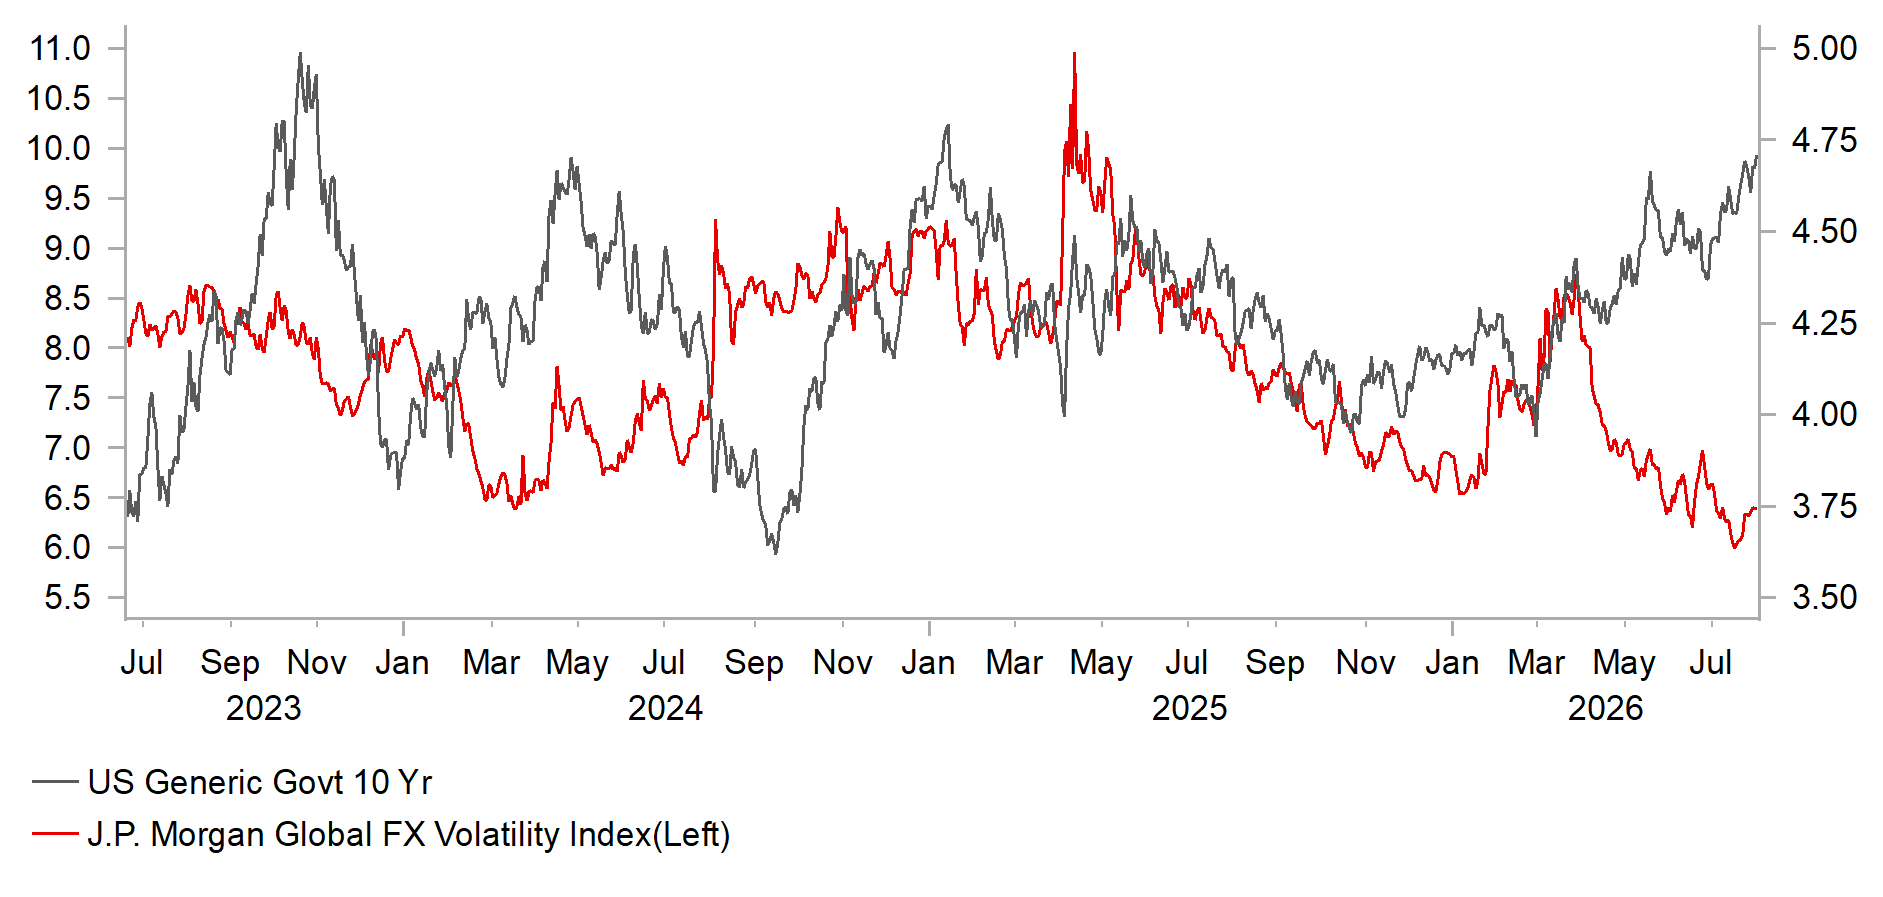
While the conflict in the Middle East is long-running and you get the sense of the financial markets becoming more confident in the idea that the energy markets can manage this supply disruption given the overall more favourable supply / inventory backdrop there remains a risk that this could quickly be viewed as investor complacency. It certainly looks more plausible now that this back and forth between ceasefires and re-escalations could drag on a lot longer and that means time becomes the threat of a turn in current energy market dynamics. How much traffic is getting through the Strait of Hormuz remains key. There is also a growing risk in our view that the channel for triggering a wider bout of financial market volatility is not directly through a further notable spike in energy prices but through a continued grind higher in longer-term yields. Increasing market rates look less and less compatible with broader financial market conditions – record equity market levels, multi-year lows in FX volatility (before intervention anyway) and continued narrow corporate spreads could be threatened by the steady rise in yields. If energy prices merely remain elevated at these levels more active central bank policy tightening by September/October time is a growing risk that could challenge the ongoing exceptional appetite for risk. This is risk may have receded a little with President Trump citing another ceasefire and negotiations although Iran denies this.
2) CENTRAL BANK MEETINGS & INTERVENTION WATCH
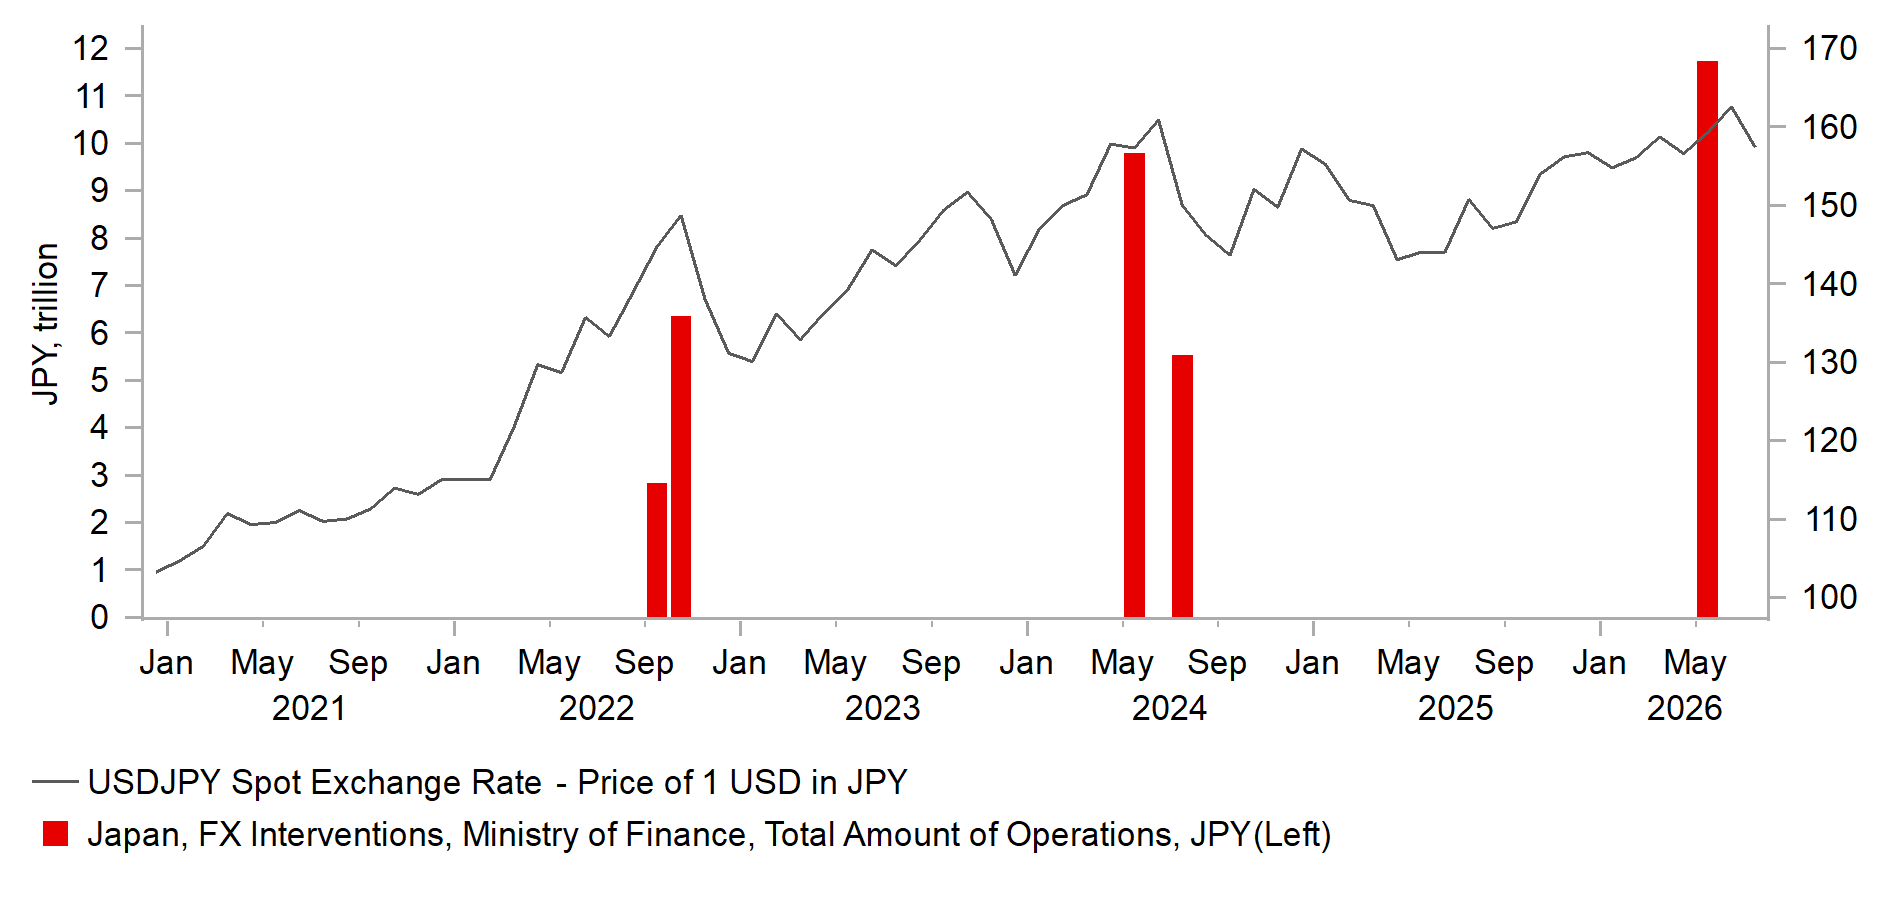
After a busy July we enter the summer lull in August with just three G10 central banks meeting – the RBA on 11th August, the Norges bank on 13th and the Riksbank on 20th. There is little prospect of a move from either the RBA or the Riksbank and market pricing reflects that. For Norges bank, the rates market implies close to a 40% chance of a hike. We expect Norges bank to hold off and hike in September but a hike in August is certainly feasible. The other key central bank-related event in August will be the Jackson Hole symposium which will be held between 27th-29th August. The title this year is “Financial Innovation: Implications for Payments and Policy”. The FX markets will start August on edge with joint intervention confirmed between Japan and the US following a record one-day intervention by Japan on 30th July (estimated JPY 8.45trn). From a historic perspective this is very significant and joint interventions in 1995, 1998 and 2011 all roughly marked turning points for USD/JPY trends.
3) WATCH POLICY IMPLEMENTATION POST JULY POLITBURO MEETING
The July Politburo meeting readout was largely in line with market expectations, with the emphasis on quicker implementation of the existing policies in 2H 2026. We should expect follow-up actions from various ministries and will watch closely to see if those actions can translate into firmer domestic activity. 2026 is the first year of the 15th Five-Year Plan, which makes August an important month for policy follow-through. Actions on AI Plus themes are important for RMB performance.
Forecast rates against the US dollar - End-Q3 to End-Q2 2027
Spot close 31.07.26 | Q3 2026 | Q4 2026 | Q1 2027 | Q2 2027 | |
DXY | 100.077 | 100.860 | 99.290 | 97.740 | 96.190 |
JPY | 159.23 | 158.00 | 156.00 | 154.00 | 152.00 |
EUR | 1.1509 | 1.1400 | 1.1600 | 1.1800 | 1.2000 |
GBP | 1.3465 | 1.3260 | 1.3330 | 1.3490 | 1.3640 |
CNY | 6.7524 | 6.7000 | 6.6500 | 6.6000 | 6.6000 |
AUD | 0.7022 | 0.7000 | 0.7100 | 0.7200 | 0.7300 |
NZD | 0.5876 | 0.5700 | 0.5800 | 0.5900 | 0.6000 |
CAD | 1.4026 | 1.4100 | 1.3900 | 1.3800 | 1.3600 |
NOK | 9.4843 | 9.7370 | 9.6550 | 9.4920 | 9.2500 |
SEK | 9.5303 | 9.6490 | 9.3970 | 9.1530 | 8.9170 |
CHF | 0.8087 | 0.8200 | 0.8020 | 0.7800 | 0.7630 |
|
|
|
|
|
|
CZK | 21.028 | 21.140 | 20.690 | 20.250 | 19.830 |
HUF | 316.54 | 315.80 | 306.00 | 296.60 | 291.70 |
PLN | 3.7417 | 3.7890 | 3.7070 | 3.6270 | 3.5500 |
RON | 4.5580 | 4.5960 | 4.5430 | 4.4920 | 4.4330 |
RUB | 78.933 | 79.020 | 79.290 | 79.560 | 80.730 |
ZAR | 16.533 | 16.700 | 16.500 | 16.300 | 16.000 |
TRY | 47.522 | 49.000 | 51.500 | 53.500 | 55.000 |
|
|
|
|
|
|
INR | 95.385 | 94.000 | 94.500 | 95.500 | 96.500 |
IDR | 18019 | 18100 | 18350 | 18500 | 18700 |
MYR | 4.0835 | 4.1000 | 4.1500 | 4.1000 | 4.0000 |
PHP | 61.240 | 61.750 | 61.500 | 61.000 | 60.500 |
SGD | 1.2832 | 1.2900 | 1.2900 | 1.2850 | 1.2700 |
KRW | 1437.0 | 1440.0 | 1420.0 | 1400.0 | 1380.0 |
TWD | 32.292 | 32.100 | 31.800 | 31.600 | 31.400 |
THB | 33.415 | 33.800 | 34.400 | 34.000 | 33.800 |
VND | 26290 | 26400 | 26500 | 26600 | 26700 |
|
|
|
|
|
|
ARS | 1488.9 | 1525.0 | 1575.0 | 1625.0 | 1675.0 |
BRL | 5.0704 | 5.2000 | 5.1000 | 5.0000 | 4.9000 |
CLP | 926.90 | 920.00 | 910.00 | 880.00 | 870.00 |
MXN | 17.325 | 17.500 | 17.500 | 17.250 | 17.250 |
| |||||
SAR | 3.7551 | 3.7500 | 3.7500 | 3.7500 | 3.7500 |
EGP | 51.119 | 49.750 | 51.000 | 52.500 | 54.000 |
Notes: All FX rates are expressed as units of currency per US dollar bar EUR, GBP, AUD and NZD which are expressed as dollars per unit of currency. Data source spot close; Bloomberg closing rate as of 5:00pm London time, except VND which is local onshore closing rate. All consensus forecasts are Bloomberg sourced.
US dollar
Spot close 31.07.26 | Q3 2026 | Q4 2026 | Q1 2027 | Q2 2027 | |
USD/JPY | 159.23 | 158.00 | 156.00 | 154.00 | 152.00 |
EUR/USD | 1.1509 | 1.1400 | 1.1600 | 1.1800 | 1.2000 |
Consensus | Consensus | Consensus | Consensus | ||
USD/JPY | 160.00 | 159.00 | 157.50 | 155.00 | |
EUR/USD | 1.1500 | 1.1600 | 1.1700 | 1.1800 |
MARKET UPDATE
In July the US dollar weakened against the euro in terms of London closing rates, from 1.1422 to 1.1509. However, the dollar strengthened against the yen, from 162.53 to 159.23. The FOMC at its meeting in July kept the range for the federal funds unchanged at 3.50%-3.75%. The FOMC confirmed the end of QT effective December last year with the Fed no longer reducing UST bond holdings. MBS holdings continue to decline but are offset by buying of US T-bills, now estimated to be running at around USD 25bn per month.
OUTLOOK
The US dollar depreciation in July on a DXY basis the drop was 1.3% primarily reflecting a modest gain in EUR/USD but a big drop in USD/JPY. A lot happened in the rates space with yields in core G10 all rising as inflation fears return due to the re-escalation of the conflict in the Middle East and hence the rebound in energy prices. Financial market conditions are remarkably stable despite the rise in yields – G10 FX volatility in July hit the lowest since 2022, the VIX has been in the 15-20 range, credit spreads are remarkably tight, and key equity indices are close to record highs. Can these conditions continue to co-exist with longer-term yields hitting levels not seen since before the GFC? We believe that will become increasingly challenging and after the August lull, September and October could be the period in which we see higher G4 rates hit risk assets leading to a turn higher in volatility and a potential bigger risk-off episode. Another possible ceasefire (according to the US) reduces this risk perhaps but whether this is genuine and will hold is very unclear.
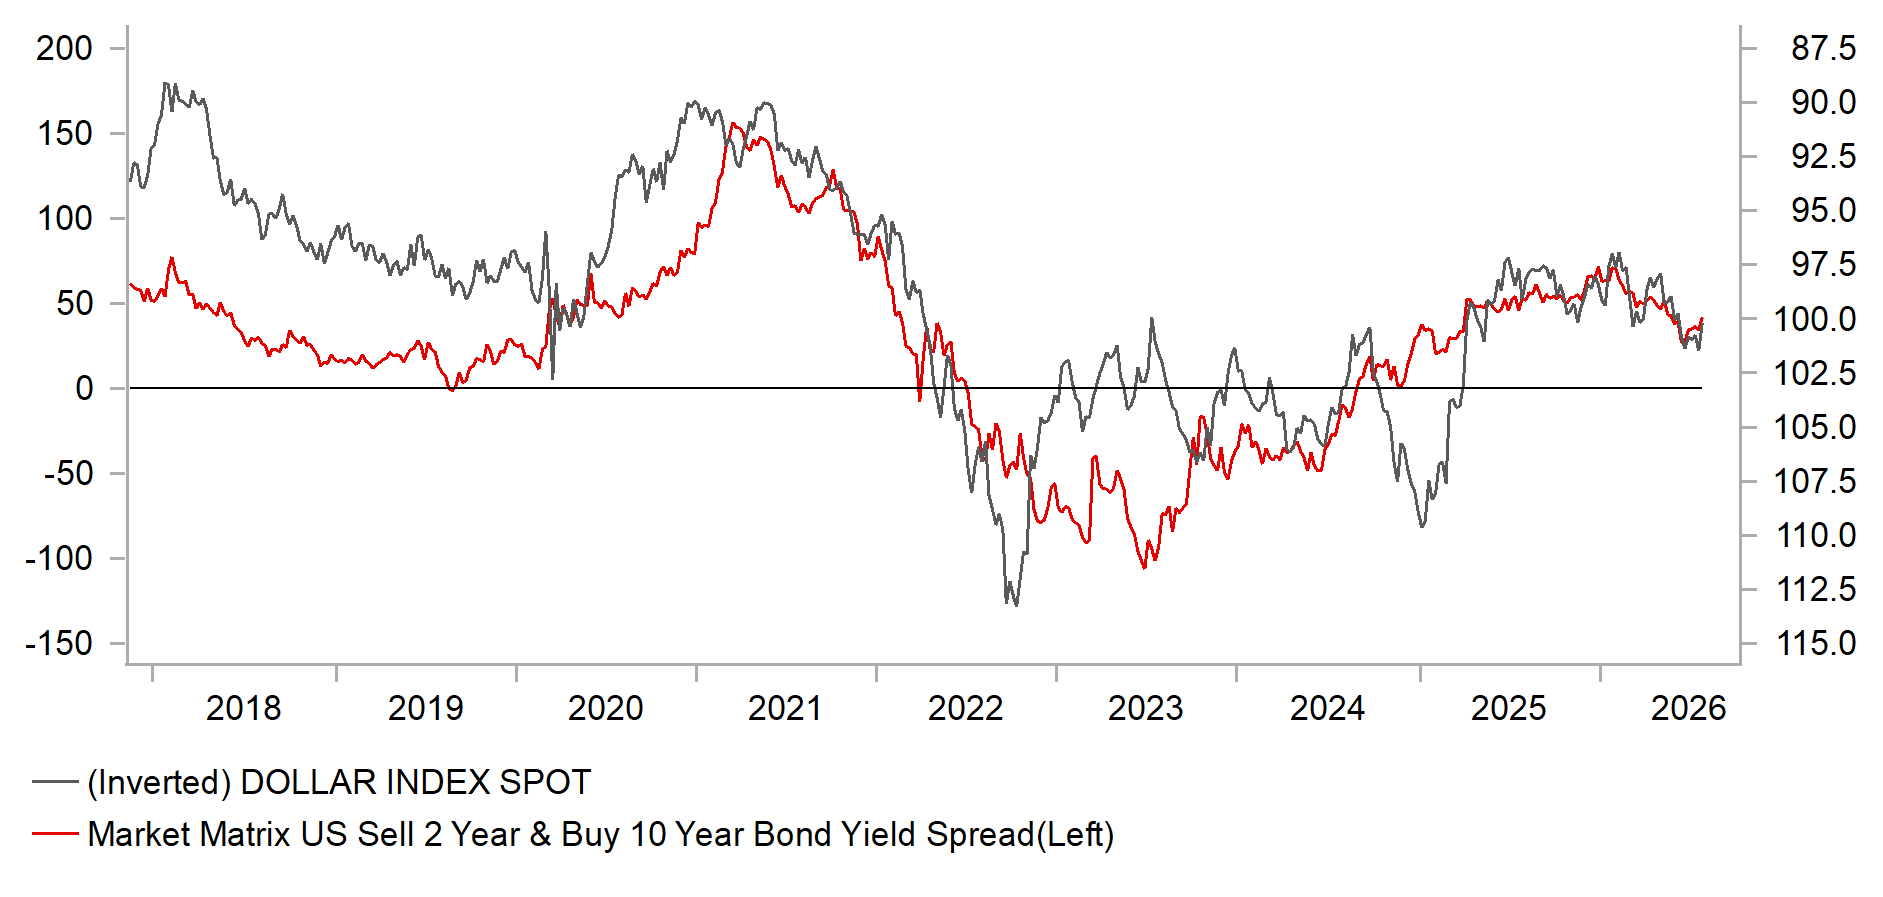
The FOMC meeting in July was remarkable more for what was not said than what was said. Chair Warsh repeatedly refused to provide an answer as to why the Fed Funds rate was not increased and appeared to imply that market rates moving higher was doing the Fed’s work. He appeared to imply a less interventionist approach to fighting inflation that investors did not like. The 2s10s steepened by the most in a year (10bps) as inflation expectations increased. The pricing for a rate cut in September dropped. Perceptions of a reluctance to hike were reinforced by President Trump’s comment after Warsh’s press conference ended that Warsh would “love to lower rates”. There were three dissents – all Presidents – and division between the Board of Governors and regional Presidents also does not help instil confidence. A further steepening of the yield curve is now more likely given the uncertainty over the Fed’s reaction function that points to increased longer-term rates volatility resulting in a larger term premium and a weaker US dollar.
We now see pricing for a Fed rate hike (we don’t expect one) remaining for longer than previously assumed and therefore the dollar should remain well supported over the coming months, especially against high-beta G10 if financial market conditions turn less favourable. Once the window for Fed hikes closes (as inflation recedes) we then expect US dollar depreciation to unfold – now more a story for 2027.
INTEREST RATE OUTLOOK
Interest Rate Close | Q3 2026 | Q4 2026 | Q1 2027 | Q2 2027 | |
Policy Rate | 3.63% | 3.63% | 3.38% | 3.13% | 3.13% |
3-Month T-Bill | 3.75% | 3.65% | 3.50% | 3.25% | 3.13% |
10-Year Yield | 4.73% | 4.25% | 4.13% | 4.00% | 3.88% |
* Interest rate assumptions incorporated into MUFG foreign exchange forecasts.
July started out with hope, there was a brief attempt at descalation in the US/Iran War to only see tensions resurface resulting in kinetic exchanges on boh sides. Our more rosey hopeful outlook was built under the assumption there could be a more lasting peace because it was in the interest of the US to get oil prices lower (to reduce inflation) and to get oil flowing too (to prevent global disruption and a hit to economic activity). Given political polling, we still partially hold this view that President Trump and Republicans do not want to see this war impact the US mid-term campaigning period. But wars clearly are highly unpredictable and if there isn’t a respite from this conflict, our fears about what this does to energy markets and global economy will only rise from here. What is not clear is does the market (and policymakers) shift their concern from inflaiton fallout to demand destruction/growth hit fears if this war drags on. In times of uncertainty, we do not believe the Fed will start a hiking campaign (especially since core inflation is not yet seeing second round effects from this process). With a lot of data to digest ahead, we too are data dependent and won’t change forecasts until we see more. Until further notice, we still think the bar to hike is high. (George Goncalves)
US 10Y TREASURY YIELD VS G10 FX VOLATILITY
Source: Bloomberg, Macrobond & MUFG GMR
US 2S10S YIELD CURVE VS DXY
Source: Bloomberg, Macrobond & MUFG GMR
Japanese yen
Spot close 31.07.26 | Q3 2026 | Q4 2026 | Q1 2027 | Q2 2027 | |
USD/JPY | 159.23 | 158.00 | 156.00 | 154.00 | 152.00 |
EUR/JPY | 183.26 | 180.10 | 181.00 | 181.70 | 182.40 |
Consensus | Consensus | Consensus | Consensus | ||
USD/JPY | 160.00 | 159.00 | 157.50 | 155.00 | |
EUR/JPY | 184.00 | 184.00 | 183.00 | 183.00 |
MARKET UPDATE
In July the yen strengthened versus the US dollar in terms of London closing rates from 162.53 to 159.23. In addition, the yen gained versus the euro from 185.64 to 183.26. The BoJ at its meeting in July left the key policy rate unchanged at 1.00%, the highest level since 1995 following three 25bp hikes since January 2025. The BoJ continues to cut JGB monthly purchases at a pace of reduction of JPY 200bn per quarter through to Q1 2027 and will then halt the reduction with monthly purchases by then falling to JPY 2trn per month.
OUTLOOK
USD/JPY plunged by five big figures on 30th July – a standard scale of decline based on previous episodes of yen buying intervention and standard timing as well. The more notable development wasn’t the intervention itself (this was the 6th episode since 2022 to buy yen) but the confirmation that Japan and the US conducted joint intervention for the first time since 2011 and first yen buying intervention since 1998. This is significant – each time joint intervention has happened in recent decades, it has marked a turning point in USD/JPY – in 1995, 1998, and 2011. Why now is the obvious question. We see a few possible key reasons that could prove important. Firstly, Japan sold a record USD 75bn of securities from its FX reserves in May (after the last intervention) and the US has probably grown concerned over rising yields in the US. Japan looks to have agreed to use a repo facility (FIMA) to swap UST holdings for cash rather than sell, reducing upward pressure on US yields. Secondly, Vice FM Mimura stated that FX policy would be conducted in coordination with BoJ monetary policy. This is significant and suggests a possible deal to open scope for a faster pace of BoJ rate hikes.
The unchanged BoJ policy stance in July was no surprise but following soon after the intervention there was anticipation of a more hawkish communication to reinforce the positive yen momentum triggered by the MoF. That didn’t happen. However, Governor Ueda said enough to trigger increased speculation of a sooner rate hike and the Mimura’s comment on FX/monetary policy coordination has lifted expectations further. Governor Ueda stated at the press conference that a faster pace of monetary tightening was possible (if financial conditions were too easy) so there is scope for a more hawkish shift. We are maintaining our view of a 25bp rate hike in September. Even though there was no strong signal there is scope there to make a shift, especially if energy prices move further higher and/or USD/JPY quickly recoups the drop following intervention. The BoJ continues to move to a more neutral policy setting and a faster pace is feasible under certain scenarios.
A BoJ rate hike in September remains our call and that faster pace of tightening and this significant joint intervention certainly changes the risk-reward equation in selling the yen. The US curve is also overpriced for Fed tightening and a drop in global yields will also serve to provide additional support for the yen.
INTEREST RATE OUTLOOK
Interest Rate Close | Q3 2026 | Q4 2026 | Q1 2027 | Q2 2027 | |
Policy Rate | 1.00% | 1.25% | 1.25% | 1.50% | 1.50% |
3-Month Bill | 1.00% | 1.10% | 1.30% | 1.50% | 1.60% |
10-Year Yield | 2.81% | 2.80% | 2.70% | 2.60% | 2.50% |
* Interest rate assumptions incorporated into MUFG foreign exchange forecasts.
The 10-year JGB yield increased in July, by 13bps to close at 2.81%, the highest monthly close since May 1997. Yields generally have moved higher reflecting both domestic factors and the move higher in yields globally due to rising energy prices. Domestically, the pace of monetary tightening has put upward pressure on JGB yields and we currently assume the BoJ will take action in September that will fuel expectations of a faster move to a neutral policy stance that should help to stabilise longer-term yields. Fiscal concerns have ebbed somewhat although the decision of the government to lower the food tax rate from 8% to 1% for two years could increase fiscal uncertainties once again. The government has promised not to use deficit-financing bonds to finance the tax cut. The 10-year JGB yield has drifted further higher than we expected and hence we will adjust our levels higher but continue to assume yields are close to stabilising as the BoJ hikes further. We also assume the conflict in the Middle East will reach a resolution in the coming months and an unwanted surge in energy prices will be avoided.
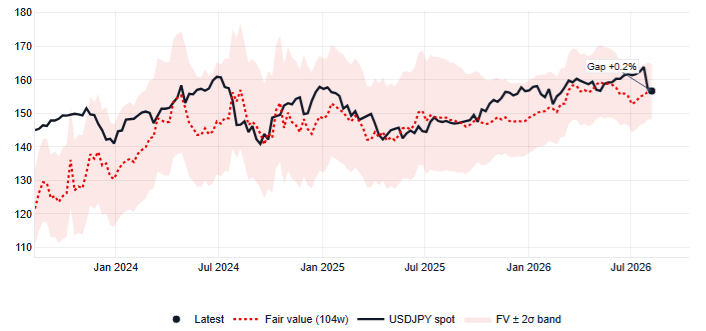
USD/JPY VS SHORT-TERM VALUATION ESTIMATE
Source: Bloomberg & MUFG GMR
USD/JPY VS FX INTERVENTION EPISODES
Source: Bloomberg, Macrobond & MUFG GMR
Euro
Spot close 31.07.26 | Q3 2026 | Q4 2026 | Q1 2027 | Q2 2027 | |
EUR/USD | 1.1509 | 1.1400 | 1.1600 | 1.1800 | 1.2000 |
EUR/JPY | 183.26 | 180.10 | 181.00 | 181.70 | 182.40 |
Consensus | Consensus | Consensus | Consensus | ||
EUR/USD | 1.1500 | 1.1600 | 1.1700 | 1.1800 | |
EUR/JPY | 184.00 | 184.00 | 183.00 | 183.00 |
MARKET UPDATE
In July the euro advanced modestly against the US dollar in terms of London closing rates from 1.1422 to 1.1509. The ECB at its meeting in July kept the deposit rate unchanged at 2.25% - following the first hike since September 2023 in June. Balance sheet reduction continues with the ECB’s projected maturities from both APP and PEPP expected to result in a EUR 500bn decline in balance sheet holdings in 2026.
OUTLOOK
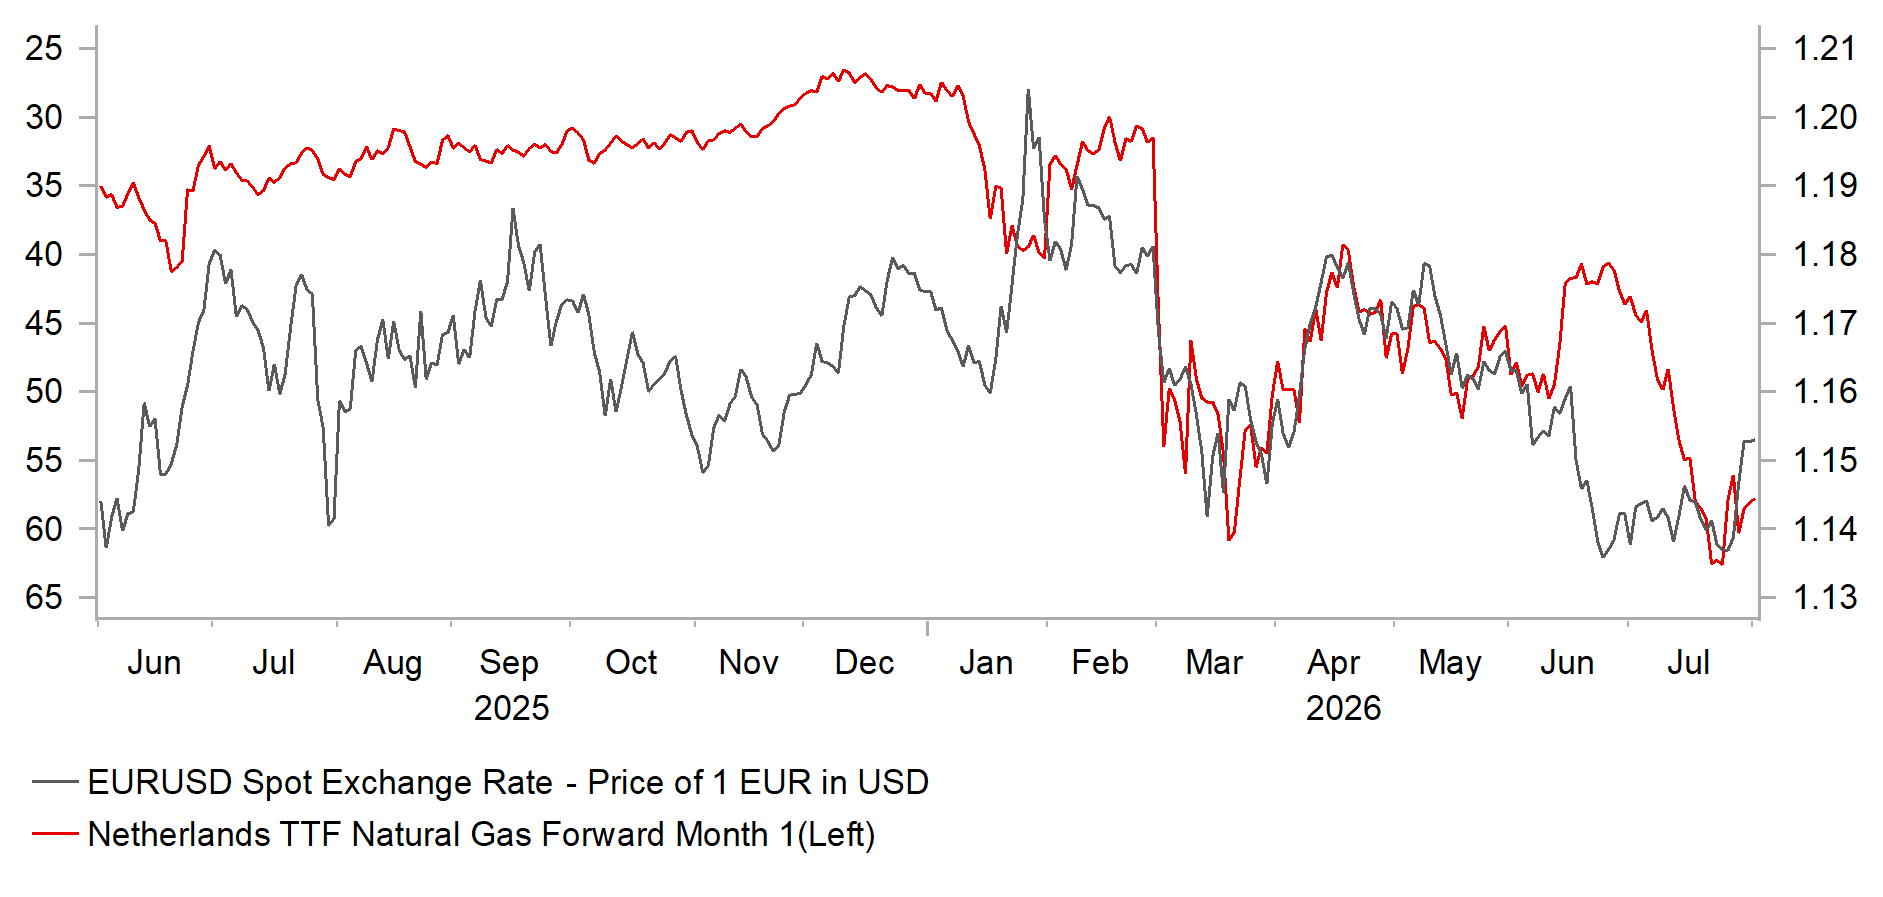
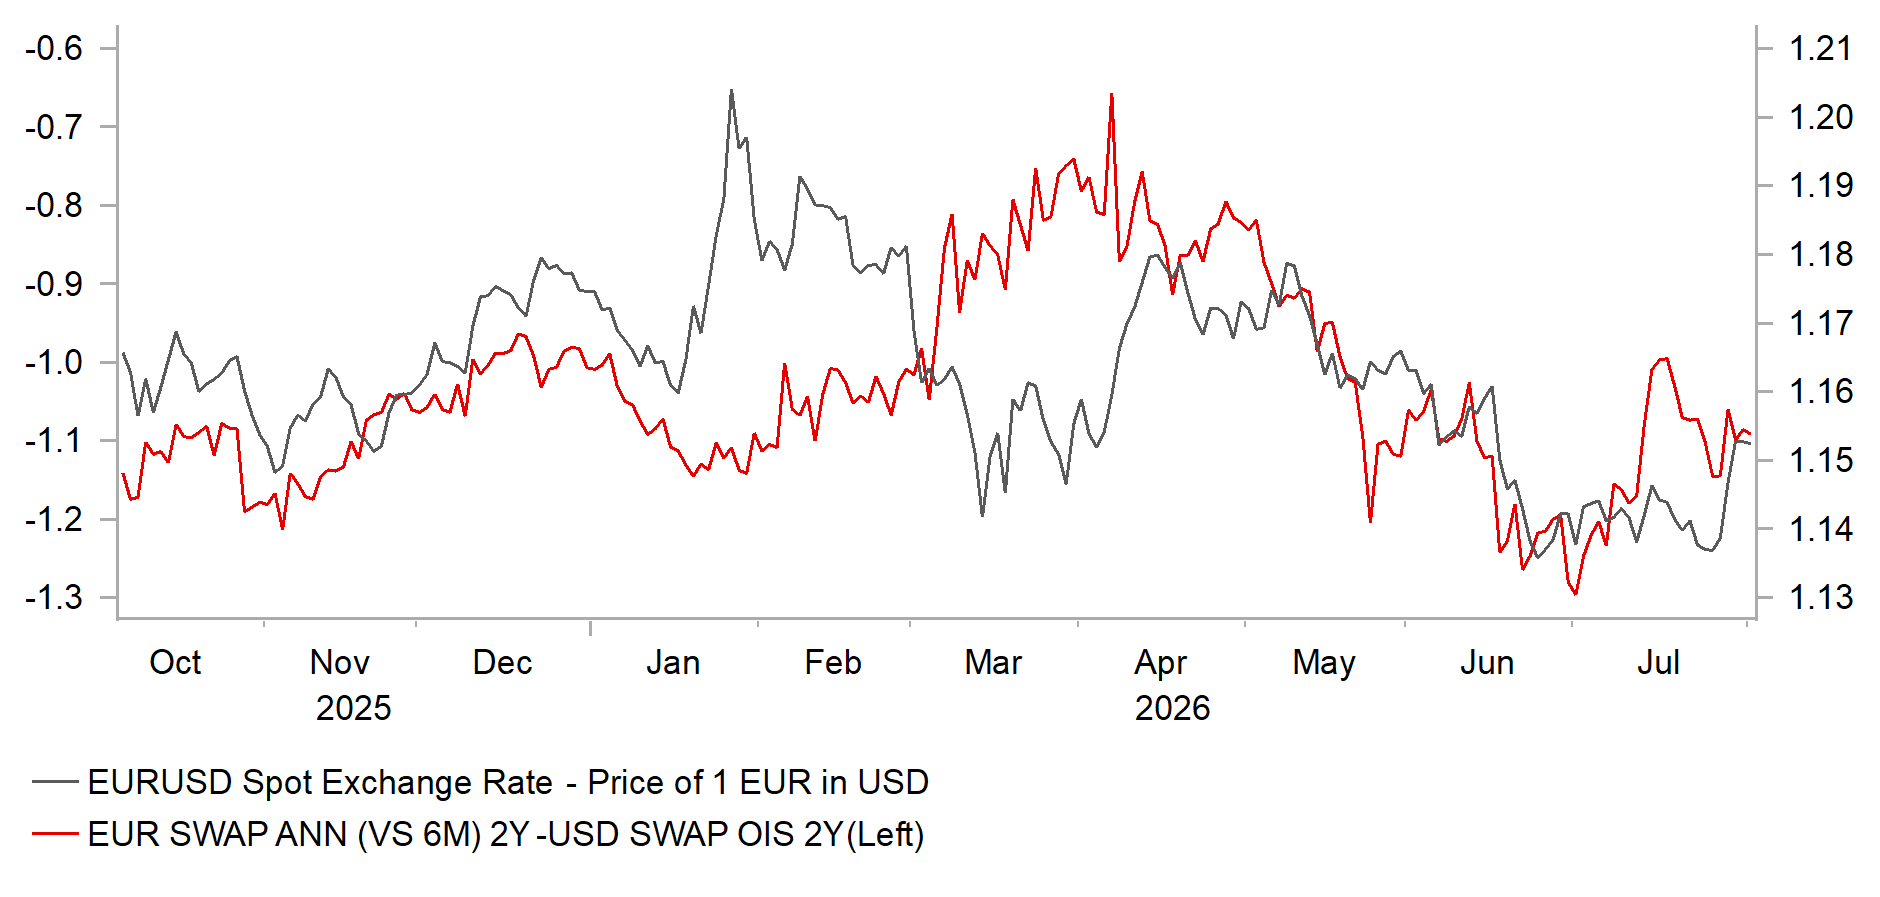
The US dollar was generally weaker in July and EUR/USD gained modestly even as Fed rate hike expectations built, in line with the re-escalation of the conflict in the Middle East and the rise in energy prices. But the move in EUR/USD over the month was relatively modest amid some concerns over the potential negative impact from the surge in natural gas prices with the front TTF contract up close to 50% in July. Higher energy prices has kept the ECB on alert, and a September rate hike is close to fully priced with another priced by March next year. For now, we continue to expect just one further hike in September, but the risks are rising of a further hike and that risk is tightly associated with the Middle East conflict and energy prices. While the ECB decision to hold in July was unanimous, President Lagarde indicated that some Governors had wondered about whether a rate hike should be considered. We already know that Chief Economist Philip Lane considers a level of 2.50% as possibly around the top-end of the neutral policy range, which further underlines the scope to hike again. A series of hikes would become justified if there was evidence of stronger second-round effects, but this evidence is yet to emerge. The ECB’s wage tracker, published in July, revealed an increase in wage growth from 2.6% in H2 2026 to 2.7% in Q1 2027. If energy prices surge again any additional Fed rate hikes priced is likely to be mirrored by the ECB.
While we do not see grounds for any notable lurch lower in EUR/USD from here, the risks have clearly shifted and there is less compelling reason to justify EUR/USD jumping higher from here over the short-term. The intra-day low in June of 1.1325 would likely only be breached on a renewed surge in energy prices that forced the Fed to hike, which is not our current view. But our short-term valuation model for EUR/USD currently highlights downside risks. However, we maintain that Fed rate hike expectations are overdone and that the Middle East conflict is more likely to de-escalate as we approach the mid-term elections in November. That should act to create a floor for EUR/USD. For now, we see the US dollar remaining firm before depreciating more notably in 2027.
But the dollar has performed better than expected and EUR/USD is lower reflecting pricing for a rate hike. While that will not be delivered, we see scope for EUR/USD remaining around current levels for longer. We still see a higher EUR/USD but those gains are more now a 2027 development as US rates fall more notably.
INTEREST RATE OUTLOOK
Interest Rate Close | Q3 2026 | Q4 2026 | Q1 2027 | Q2 2027 | |
Policy Rate | 2.25% | 2.50% | 2.50% | 2.50% | 2.50% |
3-Month Bill | 2.42% | 2.60% | 2.55% | 2.50% | 2.50% |
10-Year Yield | 3.21% | 3.10% | 3.00% | 2.90% | 2.60% |
* Interest rate assumptions incorporated into MUFG foreign exchange forecasts.
The 10-year German bund yield jumped in July, closing 35bps higher at 3.21% - the highest month-end closing rate since April 2011. Brent crude oil prices surged as the conflict in the Middle East reignited, lifting concerns over inflation. For Europe that risk was more pronounced with natural gas prices jumping to a new high since the conflict began, gaining 33% in July alone. Now is the period for refilling storage for winter and storage levels are below average. If the energy situation was to worsen on a prolonged conflict, then yields would likely move further higher but our assumption is that de-escalation is most likely with the US wanting to avoid losing support heading into the mid-term elections. Hence, we maintain our view of a gradual decline in 10-year yields with the ECB unlikely to hike further beyond September. There remains little sign of second-round effects from the energy price jump with wage growth modest, the ECB will be confident of not needing to take the policy stance into restrictive territory. In addition, we also forecast UST bond yields to decline with Fed rate hike pricing overdone and that decline will help reinforce donward pressure on Bund yields.
EUR/USD VS PRICE OF NATURAL GAS IN EUROPE
Source: : Bloomberg, Macrobond & MUFG GMR
EUR/USD VS. SHORT-TERM YIELD SPREAD
Source:: Bloomberg, Macrobond & MUFG GMR
Pound Sterling
Spot close 31.07.26 | Q3 2026 | Q4 2026 | Q1 2027 | Q2 2027 | |
EUR/GBP | 0.8547 | 0.8600 | 0.8700 | 0.8750 | 0.8800 |
GBP/USD | 1.3465 | 1.3260 | 1.3330 | 1.3490 | 1.3640 |
GBP/JPY | 214.40 | 209.40 | 208.00 | 207.70 | 207.30 |
Consensus | Consensus | Consensus | Consensus | ||
GBP/USD | 1.3300 | 1.3400 | 1.3400 | 1.3500 |
MARKET UPDATE
In July the pound strengthened versus the dollar in terms of London closing rates, moving from 1.3267 to 1.3465. In addition, the pound strengthened against the euro from 0.8609 to 0.8547. The MPC at its meeting in July kept the key policy rate unchanged at 3.75%, after six 25bp cuts since August 2024
OUTLOOK
The pound strengthened versus US dollar and the euro and the BoE TWI gained a respectable 0.8%. The pound remains the best performing G10 currency after the US dollar since the conflict began although we anticipate yield could potentially play less of a role going forward. The BoE meeting in July provided the usual update of views amongst MPC members and the policy dilemma is clear – weak domestic economic conditions are proving disinflationary but are being offset by upside inflation risks from abroad related to energy and the conflict in the Middle East. If there is de-escalation and a decline in upside inflation risks, UK yields should fall and take the pound lower. If the conflict worsens and energy prices rise further, a rate hike is possible but hiking into weak domestic economic conditions is unlikely to be currency supportive. The 6-3 vote by the MPC for unchanged rates highlights the risk of a hike if energy prices remain high. Further escalation could well cause greater disruption in financial markets given the continued rise in G4 yields and higher volatility in FX and risk assets would likely coincide with pound depreciation. The UK current account deficit financing needs tends to coincide with pound depreciation during periods of market stress. Asset valuations are becoming more stretched as G4 yields continue to grind higher.
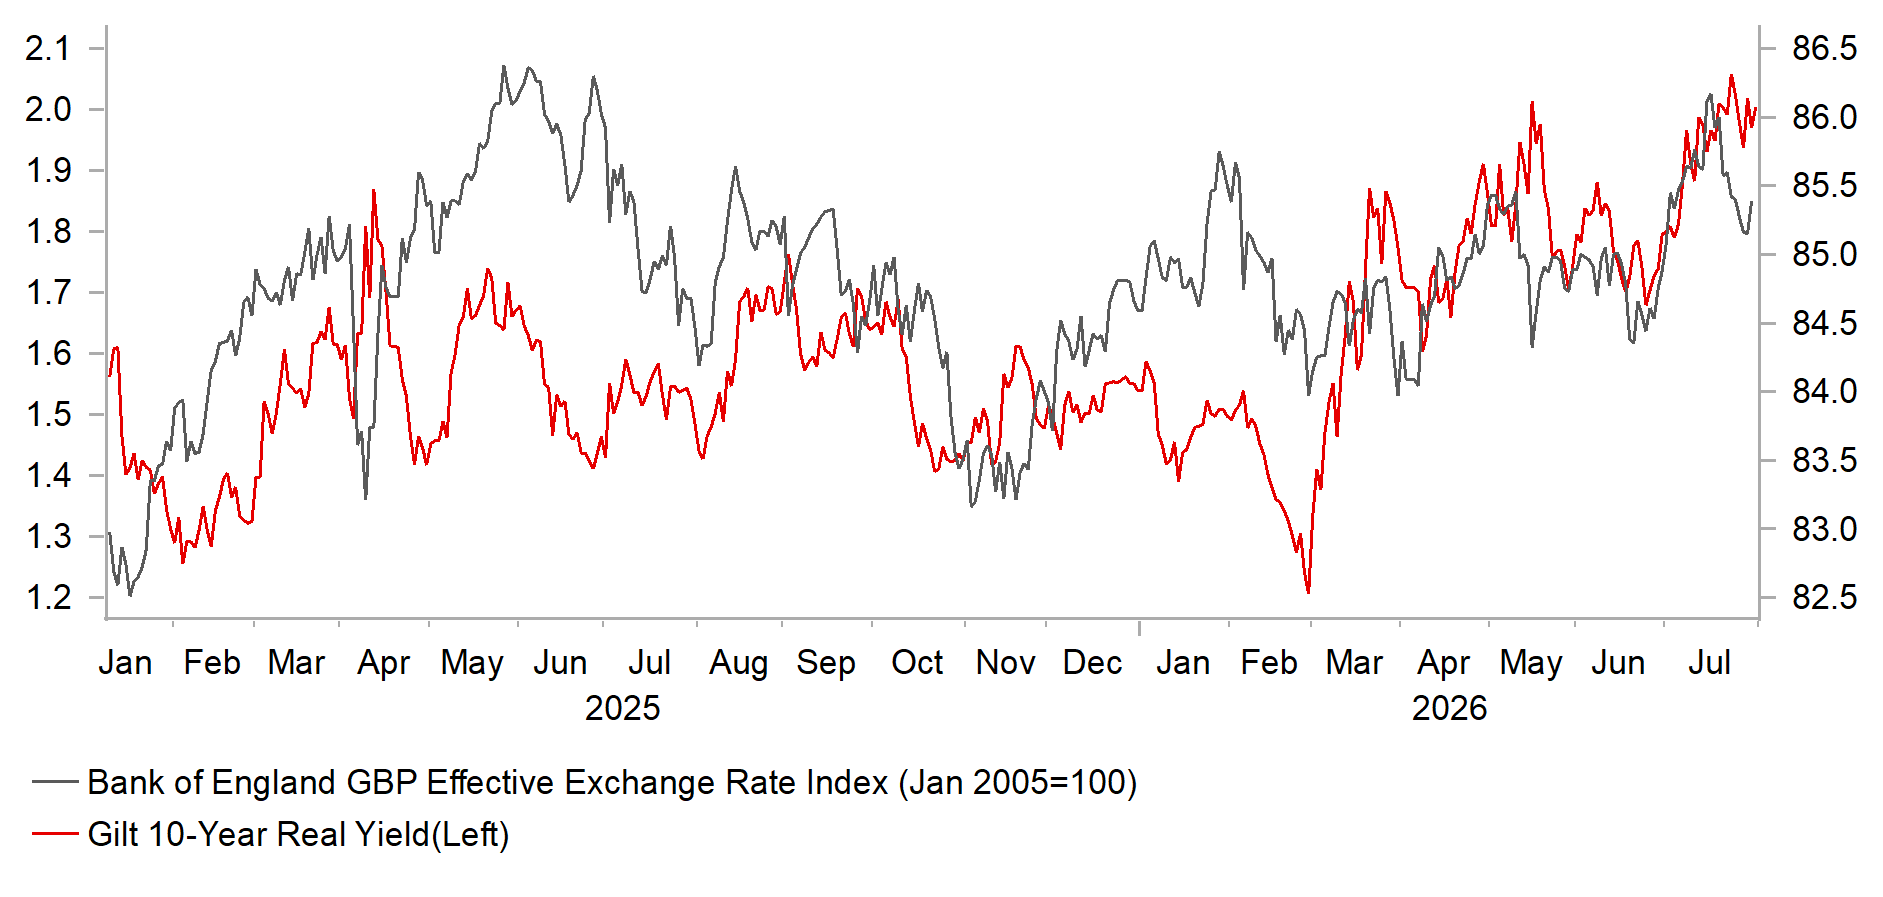
The UK 10-year Gilt real yield broke above the 2.0% level (deflated by 5y5y infl swap rate) for the first time since 2007 just before the onset of the GFC. Captured in that real yield are numerous uncertainties that contribute to the term premium. Some of that is sovereign credit risks although judging from the Gilt OIS swap spread that risk has been relatively stable. That suggests that Andy Burnham so far has done a good job in avoiding any notable jump in yields related specifically to fiscal uncertainties. But PM Burnham still has a difficult task ahead in providing low-income earners with support. The headroom from the last budget has already declined by around GBP 10bn while defence spending is already committed to rise by GBP5bn so any question marks over fiscal credibility could certainly translate quickly into Gilt volatility and renewed pound underperformance. Total headroom created in the last budget was GBP 23.8bn. A continued rise in yields from here would also add to the constraints on increased fiscal spending.
We view the UK rates market as overpriced for what the BoE delivers – currently we see the BoE staying on hold but if they hike it will still be less than currently priced (slightly more than two). The pound is therefore vulnerable to weakening and given our US dollar view that weakness will most likely be versus the euro
INTEREST RATE OUTLOOK
Interest Rate Close | Q3 2026 | Q4 2026 | Q1 2027 | Q2 2027 | |
Policy Rate | 3.75% | 3.75% | 3.75% | 3.50% | 3.50% |
3-Month Bill | 3.91% | 3.85% | 3.75% | 3.40% | 3.40% |
10-Year Yield | 5.05% | 5.00% | 4.90% | 4.50% | 4.40% |
* Interest rate assumptions incorporated into MUFG foreign exchange forecasts.
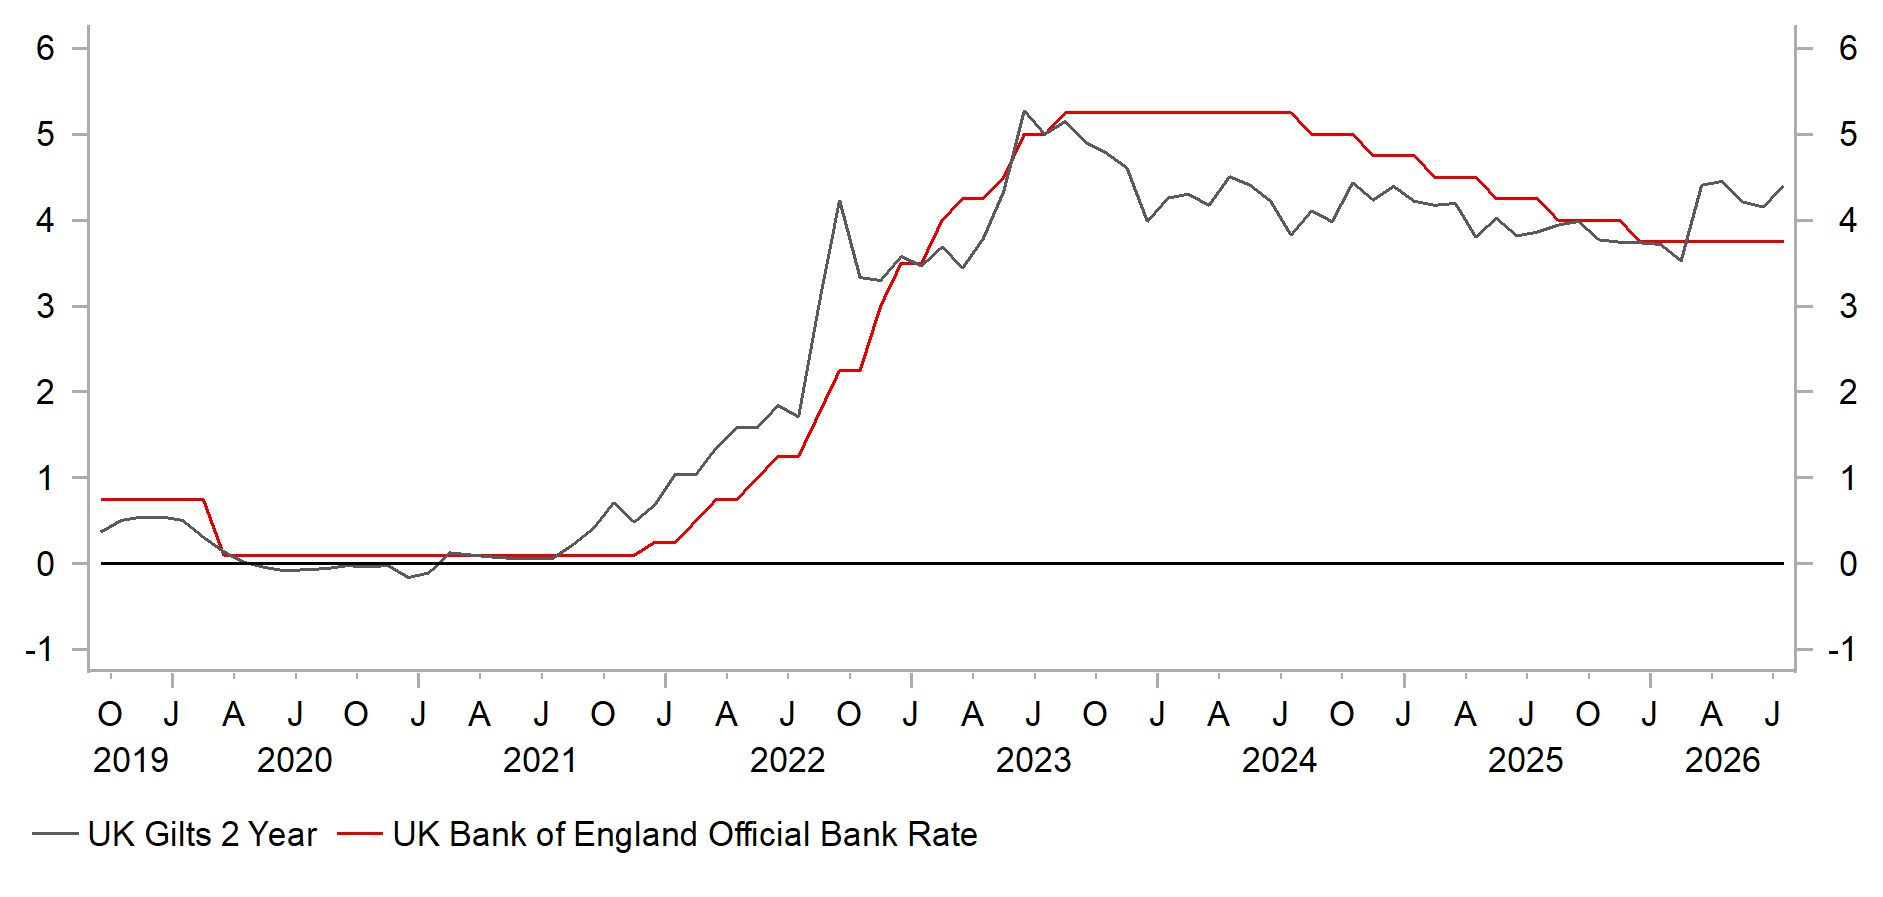
The 10-year Gilt yield jumped notably in July, by 29bps to close at 5.05%. The re-escalation of the conflict in the Middle East and the jump in energy prices prompted the jump in yields. The UK breakeven rate and 5y5y inflation swap rate both increased by about 5bps indicating a notable jump in real yields. BoE rate hike expectations certainly jumped and we suspect the move at the front-end of the curve is now overdone. The 2-year Gilt yield closed 65bps above the official policy rate and given the domestic economic backdrop has been more consistent with disinflation we doubt the BoE will be forced to hike as much as currently priced. The vote was 6-3 for unchanged rates and if energy prices rises persist on a prolonged conflict a hike is certainly possible but with domestic economic conditions mixed, that action could ultimately help flatten the curve, certainly if the US-Iran conflict was to de-escalate and energy prices fall back. The worst case scenario for you view of a decline in 10-year Gilt yields would be a prolonged conflict, much higher energy prices and increased fiscal uncertainties due to poor policy management by the government. Our assumption is that scenario is avoided and Gilt yields retrace back lower
GBP TWI VS UK 10YR YIELD
Source: : Bloomberg, Macrobond & MUFG GMR
UK 2Y GILT YIELD VS BOE POLICY RATE
Source: : Bloomberg, Macrobond & MUFG GMR
Chinese renminbi
Spot close 31.07.26 | Q3 2026 | Q4 2026 | Q1 2027 | Q2 2027 | |
USD/CNY | 6.7524 | 6.7000 | 6.6500 | 6.6000 | 6.6000 |
USD/HKD | 7.8415 | 7.8300 | 7.8300 | 7.8300 | 7.8300 |
Consensus | Consensus | Consensus | Consensus | ||
USD/CNY | 6.7600 | 6.7000 | 6.7000 | 6.6700 | |
USD/HKD | 7.8300 | 7.8200 | 7.8100 | 7.8000 |
MARKET UPDATE
In July, USD/CNY moved from 6.7857 to 6.7524. On 20th July, the PBoC kept the 1Y and 5Y LPR steady at 3.00% and 3.50% respectively. In mid-July, PBoC Deputy Governor Zou Lan hinted the possibility of deploying structural monetary policy tools based on market needs, and separately July Politburo meeting readout mentioned to “comprehensively use and timely adjust monetary policy tool”.
OUTLOOK
China’s Q2 GDP surprised to the downside with growth slowing to 4.3%yoy from 5.0% in Q1, coupled with lower sequential growth momentum (-0.4ppts to 0.9%qoq). Weak domestic demand from both consumption and investment dragged on overall growth by 0.4ppts each. Combined with the June macroeconomic data, the deepening K-shape growth pattern in the economy became even clearer. The readout from the July Politburo meeting showed the authorities are paying greater attention to the challenges facing the economy, but the policy emphasis for now is a quicker implementation of the existing measures. That said, they mentioned to introduce effective incremental policy measures in a timely manner, which implies that it will happen when the existing measures fail to stabilize the economy. On consumption, it continues to emphasize supply-driven approach to unleashing services demand. Looking ahead, we think the K-shape growth will likely persist, but the divergence may narrow somewhat in 2H given a faster fiscal rollout including fiscal support for “six networks” construction. In terms of long-term consumption expansion plans for the 15th Five-Year Plan period, total retail sales of consumer goods are expected to reach RMB 60tn by 2030, implying merely an annualized growth of 3.7% from 2025 to 2030. One key highlight of the plan however was positioning housing consumption as means to boost durable goods consumption, with housing quality upgrade as a key lever.
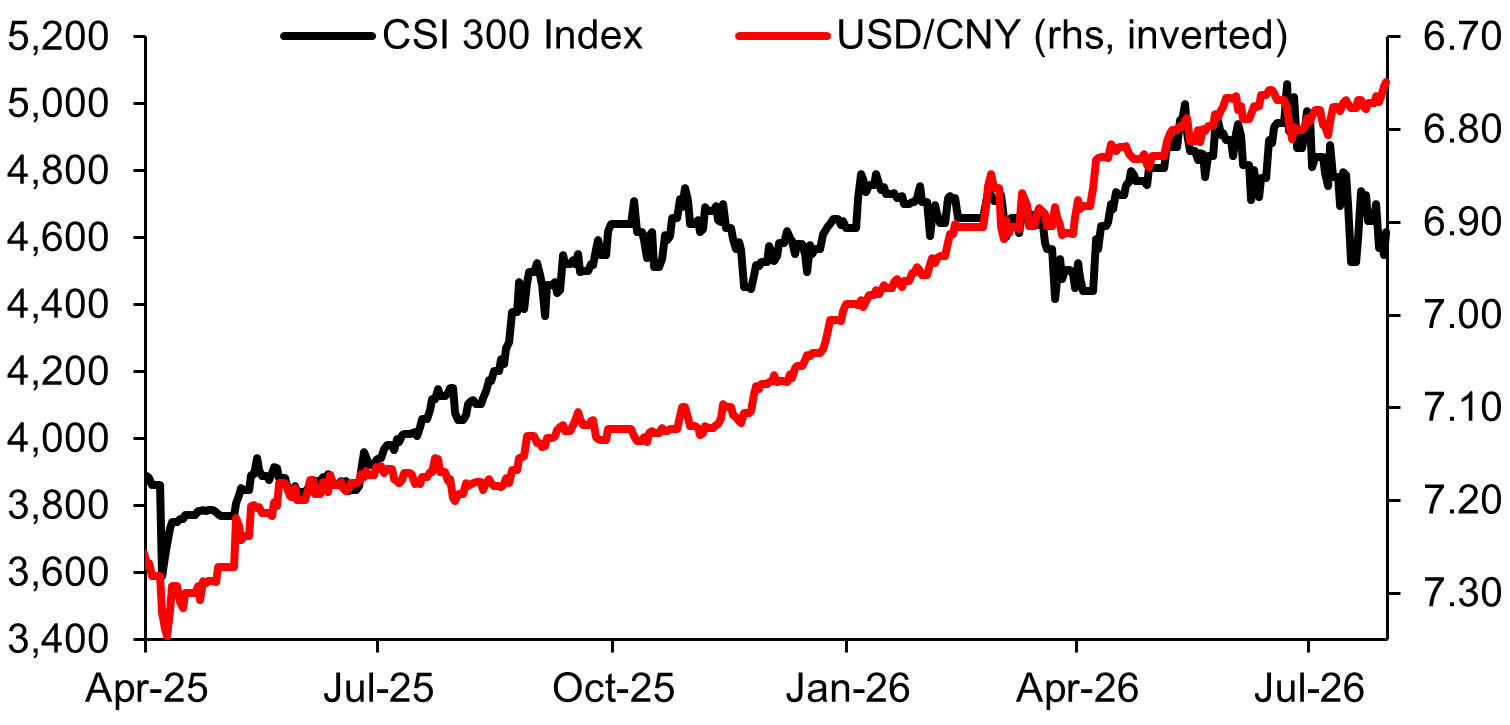
CNY appreciation trend remained in July albeit at a gradual pace, gaining 0.5% against US dollar. Strong exports performance continued to lend support for the currency, and the release of Moonshot Kimi K3 model also reinforced the structural theme around China’s fast-rising tech capability and asset revaluation. That said, China’s equity market was not shielded from global market volatility caused by the AI concerns in July but should eventually stabilize and attract foreign equity inflow. That said, what will likely slow the pace of CNY appreciation ahead remains on the domestic growth headwind and that the latest July official PMIs showed unexpected contraction in both manufacturing and non-manufacturing activities, with new orders evidently declining. While the July Politburo meeting signalled readiness to step in with incremental measures, we expect some stabilization in near term and an overall modest growth pickup in 2H. Externally, the Fed rate path, US yields and US dollar trends continue to matter. The downside risk on CNY however lies on PBoC delivering policy rate cuts and Fed eventually starting a rate hiking cycle, which will widen the negative yield differential with the US
INTEREST RATE OUTLOOK
Interest Rate Close | Q3 2026 | Q4 2026 | Q1 2027 | Q2 2027 | |
LPR 1Y | 3.00% | 3.00% | 3.00% | 3.00% | 3.00% |
7-Day Reverse Repo Rate | 1.40% | 1.40% | 1.40% | 1.40% | 1.40% |
10-Year Yield | 1.73% | 1.75% | 1.80% | 1.85% | 1.85% |
* Interest rate assumptions incorporated into MUFG foreign exchange forecasts.
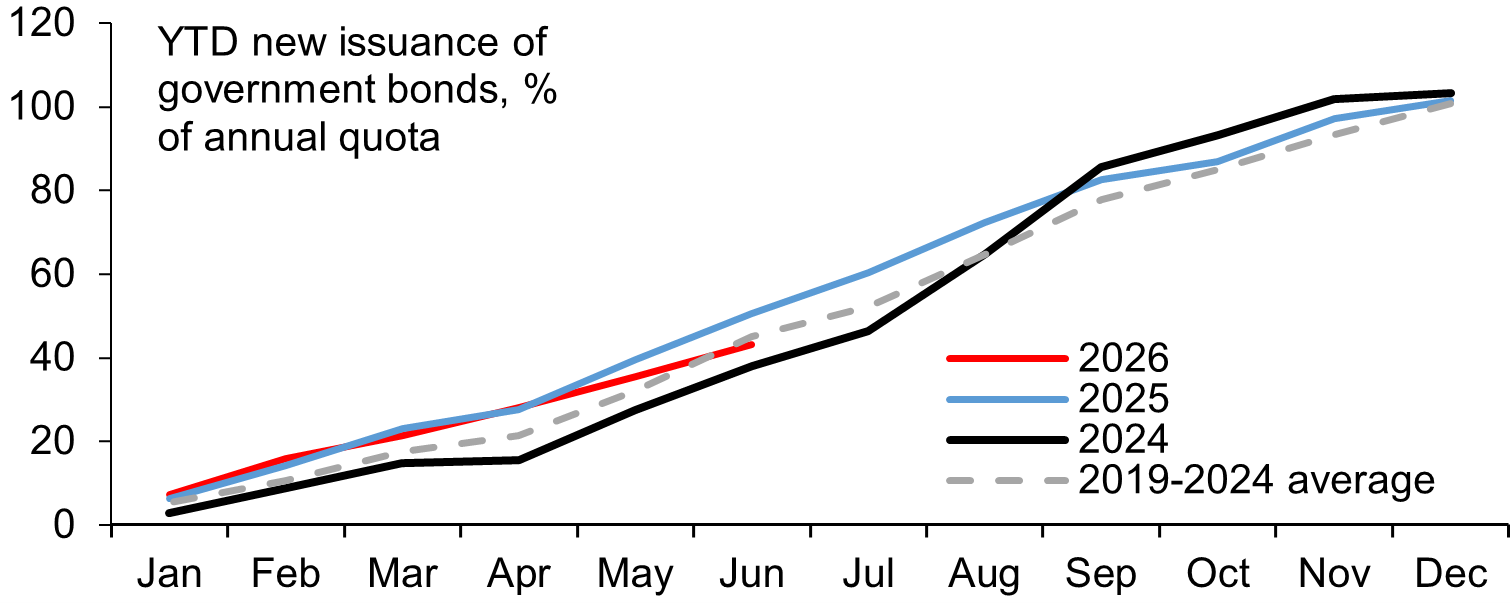
Following the July Politburo meeting readout, the bond market reaction suggests slightly increased expectations of a policy rate cut with 10y CGB yield moving lower by 2bps to 1.71%, which is not insignificant considering recent low volatility. Indeed, the government will likely roll out incremental monetary easing measures first before considering additional measures on fiscal front if growth continues to worsen, but that may be done through targeted credit easing and not a broad-based rate cut in our view, given already low bank’s net interest margin. Looking ahead, the overall bond supply pressure (excluding LGB for debt swap) will intensify in 2H with 57% annual quota remaining, equivalent to RMB 6.8tn. Combined with our expectations of no policy rate cuts and gradual reflation, we think upside risk still persists for the 10y CGB yield. That said, we think a potential increase in demand for government bonds may provide some offset, as banks likely continue to face weak loan growth and as such investing in bonds to seek returns, and non-bank financial institutions potentially allocate more of its assets towards bonds in near term considering the recent volatility in equity market.
USD/CNY AND CSI 300 MOVEMENTS DIVERGED IN JULY
Source: : Bloomberg, MUFG GMR
SLOWER PACE OF GOVERNMENT BOND ISSUANCE IN 2Q VS 1Q THIS YEAR
Source: CEIC, MUFG GMR. Note: The bond universe includes CGB, LGB (special and general) but excluding special LGB for debt swap