Please download PDF from above for the following currencies.
Australian dollar // New Zealand dollar //Canadian dollar // Norwegian krone // Swedish Krona // Swiss franc // Czech koruna // Hungarian forint //Polish zloty // Romanian leu // Russian rouble // South African rand // Turkish lira // Indian rupee // Indonesian rupiah // Malaysian ringgit // Philippine peso //Singapore dollar // South Korean won // Taiwan dollar // Thai baht // Vietnamese dong // Argentine peso // Brazilian real // Chilean peso // Mexican peso // Saudi riyal // Egyptian pound
Monthly Foreign Exchange Outlook
DEREK HALPENNY
Head of Research, Global Markets EMEA and International Securities
Global Markets Research
Global Markets Division for EMEA
E: derek.halpenny@uk.mufg.jp
LEE HARDMAN
Senior Currency Analyst
Global Markets Research
Global Markets Division for EMEA
E: lee.hardman@uk.mufg.jp
LIN LI
Head of Global Markets Research Asia
Global Markets Research
Global Markets Division for Asia
E: lin_li@hk.mufg.jp
KHANG SEK LEE
Associate
Global Markets Research
Global Markets Division for Asia
E: khangsek_lee@hk.mufg.jp
MICHAEL WAN
Senior Currency Analyst
Global Markets Research
Global Markets Division for Asia
E: michael_wan@sg.mufg.jp
LLOYD CHAN
Senior Currency Analyst
Global Markets Research
Global Markets Division for Asia
E: lloyd_chan@sg.mufg.jp
SOOJIN KIM
Analyst, ESG and Emerging Markets Research – EMEA
DIFC Branch – Dubai
E: soojin.kim@ae.mufg.jp
MUFG Bank, Ltd.
A member of MUFG, a global financial group
August 2025
KEY EVENTS IN THE MONTH AHEAD
1) TARIFFS GO LIVE & FOCUS SHIFTS TO IMPACT
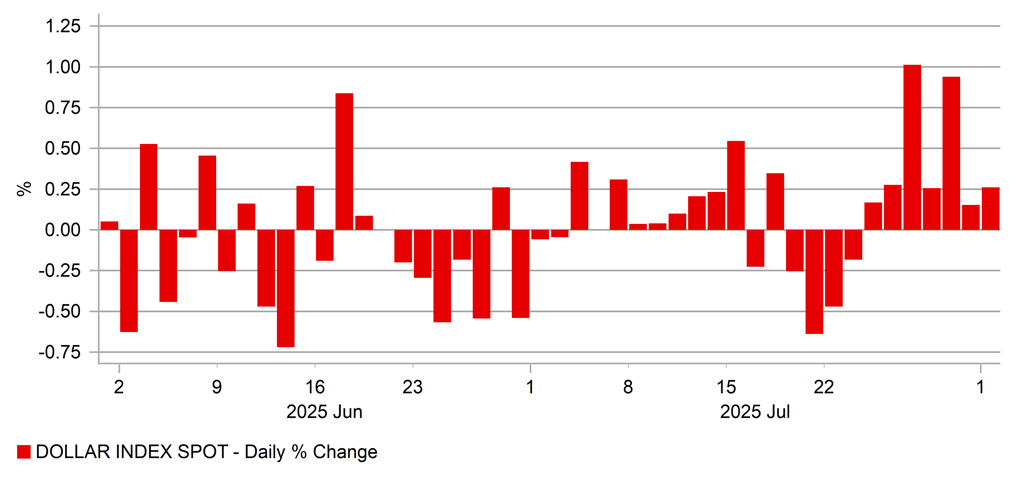
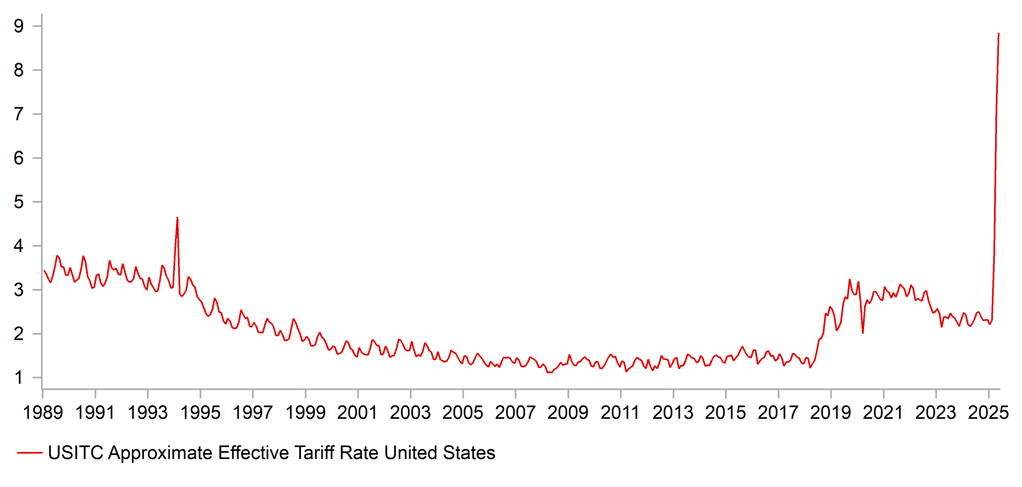
The US dollar (DXY) advanced by 3.2% in July, which was the biggest dollar gain (to two decimal places) since April 2022 when the dollar was surging as the global inflation shock was unfolding. Yields in the US did jump in July too with the 2-year UST note yield up 24bps and the 10-year UST bond yield up 14bps. The US economy continued to show resilience, best illustrated by the S&P 500 advancing to a new record high, over the 6,400-level. The White House at the end of July published updated tariff rates following a period of negotiations and while levels are generally lower than what were published in April, the Yale University Budget Lab estimated as of 30th July that the average effective tariff rate was now at 18.4%, the highest since 1933. The focus is now likely to shift to assessing the impact of these tariffs. The financial markets look to be priced optimistically for the economy to absorb these increases in our view and we see dangers of investors reassessing that optimistic view, which we believe will undermine the US dollar and hence we are maintaining our view of dollar depreciation over the period to mid-2026. We have raised our US dollar forecast levels versus EUR (slightly) and JPY (more notably) to reflect the better resilience to date. The FOMC will not meet in August but the Jackson Hole Symposium takes place between 22nd-24th August when Fed Chair Powell will give an update on the outlook for monetary policy.
2) CENTRAL BANK MEETINGS
Five G10 central banks will meet in August – the BoE (7th August); the RBA (12th); Norges Bank (14th); the RBNZ (20th); and the Riksbank (20th). The BoE and the RBA are priced close to implying a 100% probability of a cut and we concur with those expectations. The BoE’s MPC is likely to be divided once again with a chance of a repeat of the three-way vote in May with some voting for a 50bp cut, some for no cut and the majority voting for a 25bp cut. A weak inflation print for June in Australia makes a 25bp cut from the RBA highly likely while an RBNZ cut is priced at around an 80% probability. Both Norges Bank and the Riksbank are likely to keep their policy stances unchanged.
3) AWAITING THE CONFIRMATION OF TARIFF PAUSE EXTENSION
While the tone coming out of US-China Stockholm talk from both sides is positive and as such conducive for further negotiations, the confirmation of tariff pause extension by President Trump ahead of 12 August deadline matters to our expectation of US maintaining around 41% tariff on China, and as such the impact on China’s economy and CNY. Separately, we may see more China exports of rare earths to the US in July’s exports data released in the month, to demonstrate a continued friendly gesture with the US. Lastly, July’s politburo meeting ended without any signs of an imminent positive boost on the economy especially on the housing sector, and that the upcoming 15th five-year plan to be announced in October may provide a positive catalyst for CNY to strengthen.
Forecast rates against the US dollar - End-Q3 2025 to End-Q2 2026
|
Spot close 31.07.25 |
Q3 2025 |
Q4 2025 |
Q1 2026 |
Q2 2026 |
|
|
DXY |
99.832 |
98.240 |
96.720 |
95.140 |
93.600 |
|
JPY |
150.45 |
146.00 |
144.00 |
142.00 |
140.00 |
|
EUR |
1.1443 |
1.1700 |
1.1900 |
1.2000 |
1.2200 |
|
GBP |
1.3233 |
1.3530 |
1.3680 |
1.3710 |
1.3860 |
|
CNY |
7.1990 |
7.2000 |
7.2500 |
7.2000 |
7.1500 |
|
AUD |
0.6435 |
0.6500 |
0.6600 |
0.6700 |
0.6800 |
|
NZD |
0.5900 |
0.6000 |
0.6100 |
0.6200 |
0.6300 |
|
CAD |
1.3835 |
1.3600 |
1.3500 |
1.3300 |
1.3200 |
|
NOK |
10.296 |
10.171 |
9.9160 |
9.7500 |
9.5080 |
|
SEK |
9.7592 |
9.5730 |
9.3280 |
9.1670 |
8.8520 |
|
CHF |
0.8117 |
0.8210 |
0.7900 |
0.7920 |
0.7870 |
|
|
|
|
|
|
|
|
CZK |
21.477 |
20.850 |
20.420 |
20.170 |
19.670 |
|
HUF |
349.46 |
340.20 |
336.10 |
336.70 |
332.80 |
|
PLN |
3.7352 |
3.6070 |
3.5630 |
3.5500 |
3.5080 |
|
RON |
4.4302 |
4.3330 |
4.2770 |
4.2580 |
4.2130 |
|
RUB |
79.867 |
78.960 |
81.070 |
84.400 |
86.440 |
|
ZAR |
18.131 |
17.500 |
17.250 |
16.750 |
17.000 |
|
TRY |
40.590 |
42.250 |
44.500 |
46.500 |
47.500 |
|
|
|
|
|
|
|
|
INR |
87.593 |
87.800 |
87.000 |
86.500 |
86.500 |
|
IDR |
16451 |
16030 |
15890 |
15770 |
15700 |
|
MYR |
4.2650 |
4.2000 |
4.1500 |
4.0800 |
4.0600 |
|
PHP |
58.307 |
57.500 |
57.000 |
56.500 |
56.500 |
|
SGD |
1.2973 |
1.2800 |
1.2700 |
1.2600 |
1.2600 |
|
KRW |
1395.7 |
1380.0 |
1380.0 |
1375.0 |
1365.0 |
|
TWD |
29.850 |
29.800 |
29.800 |
29.650 |
29.500 |
|
THB |
32.721 |
32.800 |
32.500 |
32.400 |
32.300 |
|
VND |
26193 |
26350 |
26300 |
26300 |
26300 |
|
|
|
|
|
|
|
|
ARS |
1345.5 |
1250.0 |
1300.0 |
1350.0 |
1400.0 |
|
BRL |
5.5858 |
5.4000 |
5.3500 |
5.4500 |
5.5000 |
|
CLP |
976.30 |
940.00 |
930.00 |
935.00 |
940.00 |
|
MXN |
18.778 |
18.500 |
18.250 |
18.500 |
19.000 |
|
|
|||||
|
SAR |
3.7512 |
3.7500 |
3.7500 |
3.7500 |
3.7500 |
|
EGP |
48.620 |
50.800 |
51.000 |
51.200 |
51.400 |
Notes: All FX rates are expressed as units of currency per US dollar bar EUR, GBP, AUD and NZD which are expressed as dollars per unit of currency. Data source spot close; Bloomberg closing rate as of 4:30pm London time, except VND which is local onshore closing rate. All consensus forecasts are Bloomberg sourced.
US dollar
|
Spot close 31.07.25 |
Q3 2025 |
Q4 2025 |
Q1 2026 |
Q2 2026 |
|
|
USD/JPY |
150.45 |
146.00 |
144.00 |
142.00 |
140.00 |
|
EUR/USD |
1.1443 |
1.1700 |
1.1900 |
1.2000 |
1.2200 |
|
Consensus |
Consensus |
Consensus |
Consensus |
||
|
USD/JPY |
144.00 |
140.00 |
139.00 |
138.00 |
|
|
EUR/USD |
1.1700 |
1.1800 |
1.1900 |
1.1900 |
MARKET UPDATE
In July the US dollar advanced notably against the euro in terms of London closing rates, from 1.1746 to 1.1443. The dollar also strengthened notably against the yen, from 144.30 to 150.45. The FOMC, at its meeting in July, maintained the range for the federal funds rate at 4.25% to 4.50%, the level reached following 100bps of cuts last year. The FOMC is reducing its securities holdings with the pace of QT via the cap of UST bonds rolling off the balance sheet now at just USD 5bn. The pace of reduction in the holdings of MBS is running at around USD 15bn per month.
OUTLOOK
The US dollar rebounded sharply in July and in DXY terms gained 3.2%, the biggest monthly increase to two decimal places since April 2022. The 2-year UST note yield jumped 24bps in July with market participants readjusting views on the scope for monetary easing by the Fed. The dollar also benefitted from a large number of trade deals being reached which helped diminish investor fears over the potential damage to the US economy from high reciprocal tariff rates. It has become clearer to global investors that the Trump administration will act to reduce risks of harm to the US economy – trade deals were done with nearly all of the top trading partners of the US. Many of the key countries were hit with 15% tariffs that helped ease fears. The flow of economic data has also reinforced US economic resilience with the labour market only weakening very gradually. However, front-loading of imports in Q1 may well be a key factor in limiting the impact of tariffs to date. We still expect damage to be done from tariffs and from the normal cyclical forces that are likely to bear down on economic activity given the monetary stance remains restrictive.
Still, with limited evidence of that in the data and with the S&P 500 trading at record highs, it is understandable that the FOMC remains resistant to easing the monetary stance further. Despite the blatant calls from President Trump to cut rates, the majority of the FOMC remain concerned over inflation pass-through from tariffs and given the labour market has not worsened over recent months, the FOMC believe there is justification to wait. Given the new tariff rates only go live in August, it may well take more than one or two months to assess the impact and hence labour market weakness would more likely be the catalyst for easing. There are two NFP reports, the first of which was released just prior to this publication and the data was far weaker than expected opening up the prospect of a Fed rate cut in September. Further weakness in the jobs data coupled with the core goods inflation beginning to indicate tariff inflation risks mean the FOMC decision will be finely balanced but would lean toward a cut based on labour market weakness taking precedence.
Given the July correction was larger than anticipated, we have adjusted our dollar forecasts stronger. EUR/USD Q3 and Q4 levels are one big figure lower while USD/JPY forecasts are four big figures higher on BoJ caution evident in July and the increased political uncertainty.
INTEREST RATE OUTLOOK
|
Interest Rate Close |
Q3 2025 |
Q4 2025 |
Q1 2026 |
Q2 2026 |
|
|
Policy Rate |
4.33% |
4.13% |
3.88% |
3.63% |
3.38% |
|
3-Month T-Bill |
4.34% |
4.00% |
3.75% |
3.50% |
3.30% |
|
10-Year Yield |
4.37% |
4.38% |
4.25% |
4.13% |
4.00% |
* Interest rate assumptions incorporated into MUFG foreign exchange forecasts.
Our view up until recently had been that the sooner the Fed brings rates towards neutral (i.e. low 3% range) the less they would need to do. However with potential tariff induced inflation ahead, the macro backdrop has to worsen further to cut at every meeting ahead in 2025. Furthermore, cutting after inflation begins to rise (after they stayed in a wait-and-see period) would be at odds with the Fed’s approach. In other words, even in a minor stagflation environment where real GDP is well below potential growth and inflation rises to 3-3.5%, the US jobs data has to more than just soften for the Fed to cut multiple times in a row. The unemployment rate will likely need to trend toward 4.5% in the near-term to meet this criteria, as even slower growth in NFP may be offset by a slowdown in labor supply from immigration. Therefore we view that the window to cut the Fed Funds rate in 2025 continues to narrow (and will be data driven). We expect 2 alternating cuts in 2025, in September and December, and 4 cuts in 2026. Over the horizon, we expect more easing, linked back to the idea that the tariffs impact aggregate global demand more than they drive persistent inflation and the next Fed chair will be uber dovish.
DAILY % CHANGE IN DXY
Source: Bloomberg, Macrobond
EFFECTIVE US TARIFF RATE
Source: Bloomberg, Macrobond
Japanese yen
|
Spot close 31.07.25 |
Q3 2025 |
Q4 2025 |
Q1 2026 |
Q2 2026 |
|
|
USD/JPY |
150.45 |
146.00 |
144.00 |
142.00 |
140.00 |
|
EUR/JPY |
172.16 |
170.80 |
171.40 |
170.40 |
170.80 |
|
Consensus |
Consensus |
Consensus |
Consensus |
||
|
USD/JPY |
144.00 |
140.00 |
139.00 |
138.00 |
|
|
EUR/JPY |
167.50 |
165.50 |
167.00 |
165.00 |
MARKET UPDATE
In July the yen weakened versus the US dollar in terms of London closing rates from 144.30 to 150.45. In addition, the yen weakened versus the euro from 169.49 to 172.16. The BoJ at its meeting in July maintained the key policy rate at 0.50%, following the 25bp hike in January, the first 25bp rate hike since before the GFC in 2007. The BoJ is also continuing with the policy of cutting JGB monthly purchases at a pace of JPY 400bn per quarter but announced in June that the pace of reduction will be reduced to JPY 200bn per quarter effective from Q2 2026.
OUTLOOK
The yen weakened much more sharply than we expected in July with both Japan-specific and external factors helping to fuel yen selling. The uncertainty over the leadership of the LDP and hence the position of prime minister persists and is providing an incentive for yen selling. At the end of July, the LDP announced that a general meeting of both houses of parliament would be held on 8th August and included on the agenda of that meeting would be “future party management”. That may only entail a change in executive committee positions but it could also involve attempts to agree to an extraordinary LDP leadership election in September. The implementation of the US-Japan trade deal is currently PM Ishiba’s justification for not resigning but that deal has prompted criticism with the details of the USD 550bn investment fund unclear. The lack of detail and consistency in communication between Japan and the US has added fresh uncertainty to the trade deal.
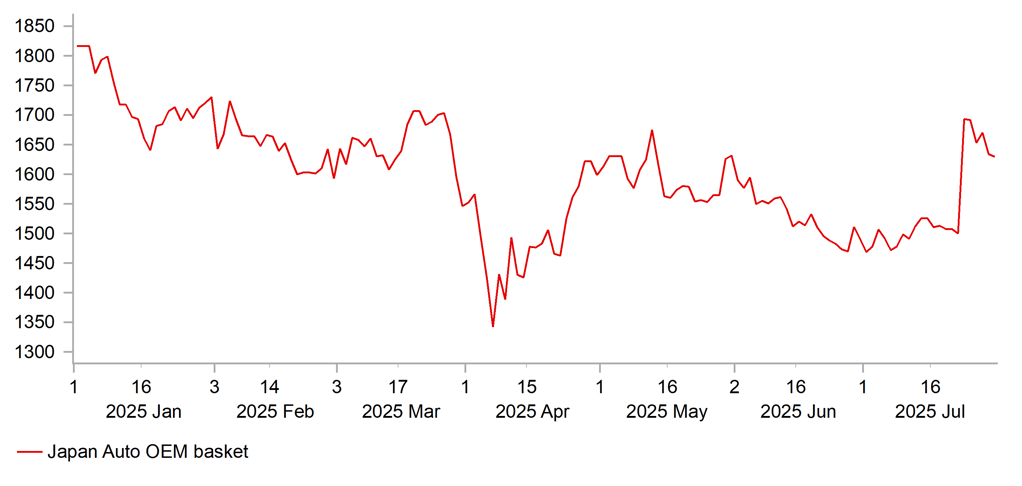
At the end of July, USD/JPY broke above the 150-level for the first time since the beginning of April, before the ‘Liberation Day’ reciprocal tariff announcements. One trigger for that was the BoJ meeting and Governor Ueda’s press conference that failed to encourage speculation on an imminent rate hike. Despite the US-Japan trade deal, the BoJ still believes the outlook is “highly uncertain” while the prospects of achieving the inflation goal has risen only “slightly”. The BoJ did raise its inflation forecasts, but by the bare minimum for FY26 and FY27 – 0.1ppt to 1.8% and 2.0% respectively. The modest shift in tone by Governor Ueda despite a trade deal with the US highlighted the caution of the BoJ in hiking rates further. Governor Ueda played down the risk of the BoJ being perceived as being behind the curve but if the yen is to extend this bout of weakness, it could fuel increased inflation expectations and in turn JGB selling. The BoJ looks to now be over-cautious and there are dangers attached to such a stance. Politically, renewed yen depreciation will not help the cause of PM Ishiba staying in office given the poor performance of the LDP was related to the cost of living crisis.
With trade uncertainties diminishing for now, the FX market focus is likely to shift back to relative macro drivers. Political uncertainty and continued caution by the BoJ contrasts with Fed resistance to easing. That has kept the yen weaker but we maintain BoJ hikes and Fed easing will help reverse the recent USD/JPY gain.
INTEREST RATE OUTLOOK
|
Interest Rate Close |
Q3 2025 |
Q4 2025 |
Q1 2026 |
Q2 2026 |
|
|
Policy Rate |
0.50% |
0.50% |
0.75% |
0.75% |
1.00% |
|
3-Month Bill |
0.42% |
0.80% |
0.90% |
0.90% |
1.10% |
|
10-Year Yield |
1.56% |
1.60% |
1.70% |
1.80% |
1.80% |
* Interest rate assumptions incorporated into MUFG foreign exchange forecasts.
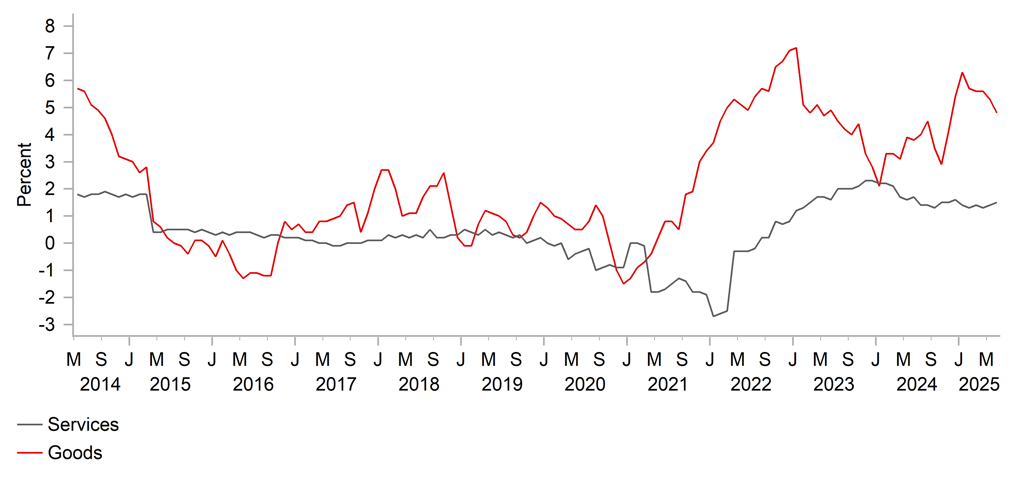
The 10-year JGB yield increased in July, by 13bps to close at 1.56%. The move closely replictaed the move higher in UST bond yields and yields in other developmed economies. The yield move also reflected the agrement reached on a trade deal between the US and Japan that reduced an element of uncertainty that could encourage the BoJ to hike its key policy rate again. While the BoJ did raise its inflation projections for FY26 and FY27, Governor Ueda remained cautious over signalling the prospect of further rate increases. Is there a risk that inflation could remain higher and increase fears over higher than expected inflation. This is certainly a risk that could fuel renewed JGB market instability. A sharper than expected depreciation of the yen would potentially lift imported inflation adding to already high food inflation. Wage growth, based on the ‘shunto’ wage negotiated deal, points to continued domestically generated inflation. Under these conditions we would expect the 10-year JGB yield to grind higher with risks of episodes in which volatility spikes on fears over debt sustainability and potentially the BoJ being too cautious.
PERFORMANCE OF JAPAN’S AUTO EXPORT SECTOR
Source: Bloomberg, Macrobond
JAPAN CPI YOY, % - SERVICES VS. GOODS
Source: Bloomberg, Macrobond
Euro
|
Spot close 31.07.25 |
Q3 2025 |
Q4 2025 |
Q1 2026 |
Q2 2026 |
|
|
EUR/USD |
1.1443 |
1.1700 |
1.1900 |
1.2000 |
1.2200 |
|
EUR/JPY |
172.16 |
170.80 |
171.40 |
170.40 |
170.80 |
|
Consensus |
Consensus |
Consensus |
Consensus |
||
|
EUR/USD |
1.1700 |
1.1800 |
1.1900 |
1.1900 |
|
|
EUR/JPY |
167.50 |
165.50 |
167.00 |
165.00 |
MARKET UPDATE
In July the euro weakened notably versus the US dollar in terms of London closing rates, moving from 1.1746 to 1.1443. The ECB, at its meeting in July kept the key policy rate unchanged at 2.00%, following 200bp of cuts since last year. The ECB is running down APP securities and started PEPP run-off in July last year with about EUR 425bn of securities estimated to roll off the balance sheet in 2025.
OUTLOOK
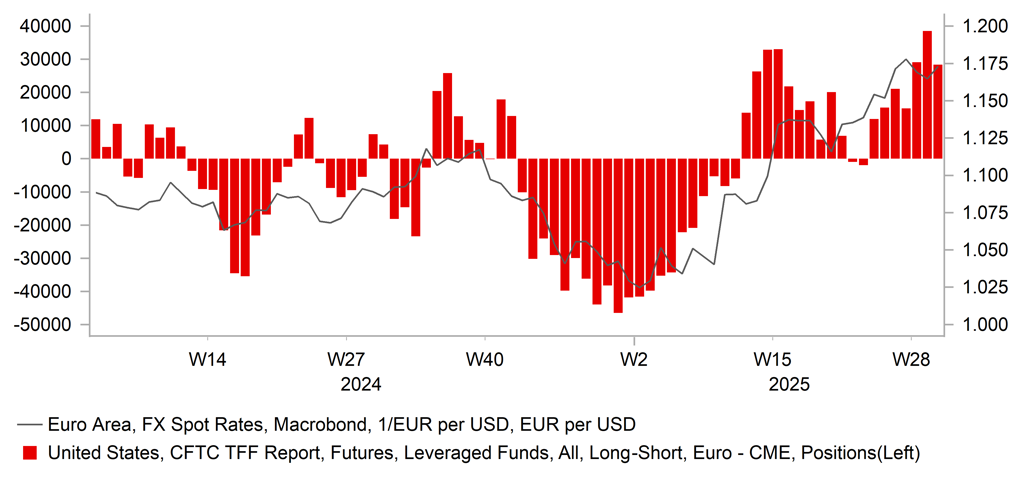
The EUR/USD drop of 2.6% recorded in July was actually the first month-on-month drop in 2025 – the gains were very modest earlier in the year before sharp increases from March. EUR/USD remains 10% higher this year but the drop back in July was more extensive than we expected. Clearly long positioning had become excessive and once the US-EU trade deal was confirmed market participants saw little need for maintaining EUR longs. Leveraged Funds’ EUR long positions in the middle of July reached the largest since 2018. The trade deal itself looked to be somewhat better than what was agreed with Japan and given most tariffs range from 15% upwards the 15% baseline tariff for the EU was a positive. The 15% tariff includes autos, pharma products and semiconductors. The steel and aluminium tariffs remains at 50% with a plan to move to a quota system, albeit with no timeframe given. There was a commitment from the EU to purchase USD 250bn worth of US energy and to increase investment in the US by USD 600bn while in addition to increase spending on US military goods. While we understand this has prompted a position adjustment and EUR selling, we do not see this as reason for an extended fall in EUR/USD.
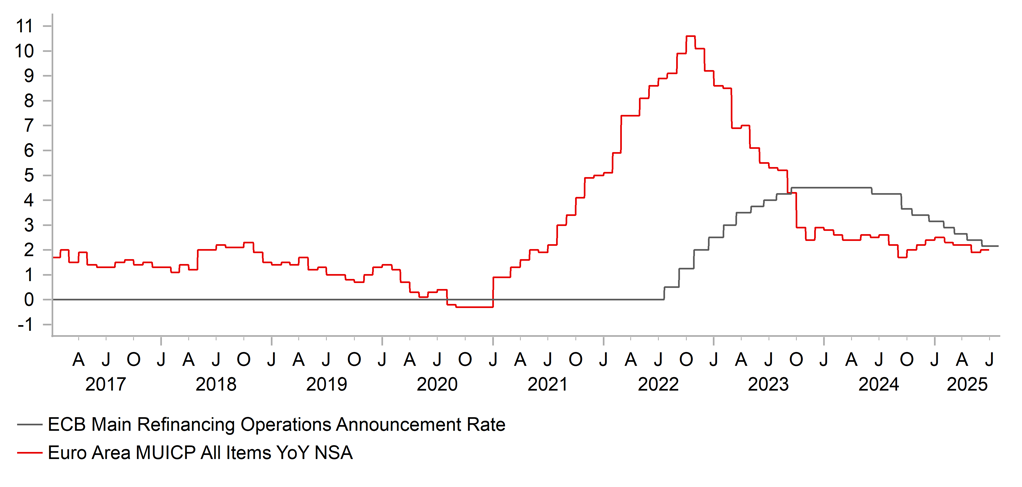
The dollar has rebounded more generally in part on expectations that broad-based tariffs will not impact the economy negatively. The negative impact of the trade deal on the EU will also be less than it could have been and the decision of the EU to agree to it and hence not retaliate will help alleviate inflation risks in the euro-zone. The ECB’s forecasts published in June were based on a baseline tariff of 10% and based on that assumption growth was set to pick up from 0.9% this year to 1.1% next year with inflation set to fall to a trough of 1.4% in Q1 2026 before returning to the 2.0% target in 2027. The disinflationary forces linked to energy and euro appreciation could now be reinforced by a tariff rate that is a little higher than assumed. However, our base-case was that the tariff would be 20% and our Economics team have revised higher the GDP projection and the rhetoric from ECB officials looks to have shifted toward caution given the policy rate has hit the 2% neutral rate. The trade deal saw rate cuts priced by the market get reduced and a 25bp cut by year-end is now not fully priced – 15bps by year-end is the current market pricing.
The correction lower in EUR/USD in July was not a huge surprise and our far more cautious forecasts for Q3 and Q4 incorporated the assumption of better two-way flows and consolidation. A move lower that extends closer to 1.1000 remains unlikely but we have still adjusted lower our year-end forecast by 1 big figure to 1.1900.
INTEREST RATE OUTLOOK
|
Interest Rate Close |
Q3 2025 |
Q4 2025 |
Q1 2026 |
Q2 2026 |
|
|
Policy Rate |
2.00% |
2.00% |
1.75% |
1.50% |
1.50% |
|
3-Month Bill |
1.96% |
1.70% |
1.50% |
1.55% |
1.55% |
|
10-Year Yield |
2.70% |
2.75% |
2.60% |
2.55% |
2.55% |
* Interest rate assumptions incorporated into MUFG foreign exchange forecasts.
The 10-year bund yield increased again, by 9bps to close at 2.71%. The main catalyst for the move higher was the US-EU trade deal with reports of the deal triggering a jump higher in yields. The 15% baseline tariff rate is less than the 30% threatened of course but it is also 5ppts higher than the baseline assumption made by the ECB in its forecasts produced in June. But relative to our previous yield forecasts we have tweaker higher. This reflects the fact that we assume the US-EU trade deal would incorporate a 20% tariff, so the deal is a little better than we expected. Real GDP growth could now reach 1.2% this year as opposed to 0.9% previously. We ahd also assumed the ECB would cut on two more ocassions this year but we now assume the ECB will cut just once further to 1.75%. The rates market jumped on news of a deal and now less than one further rate cut is priced by year-end. Still, disinflationary forces related to currency appreciation (even following some correction weaker), notable declines in wage growth and energy price declines will likely be enough to exert declines in inflation that encourages the ECB to act again. Longer-term yields will remain more elevated and a steeper curve is likely.
EUR/USD VS. EUR - IMM POSITIONING
Source: Bloomberg, Macrobond
ECB POLICY RATE VS. EURO AREA CPI YOY, %
Source: Bloomberg, Macrobond
Pound Sterling
|
Spot close 31.07.25 |
Q3 2025 |
Q4 2025 |
Q1 2026 |
Q2 2026 |
|
|
EUR/GBP |
0.8647 |
0.8650 |
0.8700 |
0.8750 |
0.8800 |
|
GBP/USD |
1.3233 |
1.3530 |
1.3680 |
1.3710 |
1.3860 |
|
GBP/JPY |
199.09 |
197.50 |
197.00 |
194.70 |
194.10 |
|
Consensus |
Consensus |
Consensus |
Consensus |
||
|
GBP/USD |
1.3600 |
1.3600 |
1.3700 |
1.3800 |
MARKET UPDATE
In July the pound weakened against the US dollar in terms of London closing rates from 1.3702 to 1.3233. In addition, the pound weakened against the euro from 0.8572 to 0.8647. The MPC, did not meet in July, and hence the key policy rate was unchanged at 4.25%, following four 25bp cuts since August last year.
OUTLOOK
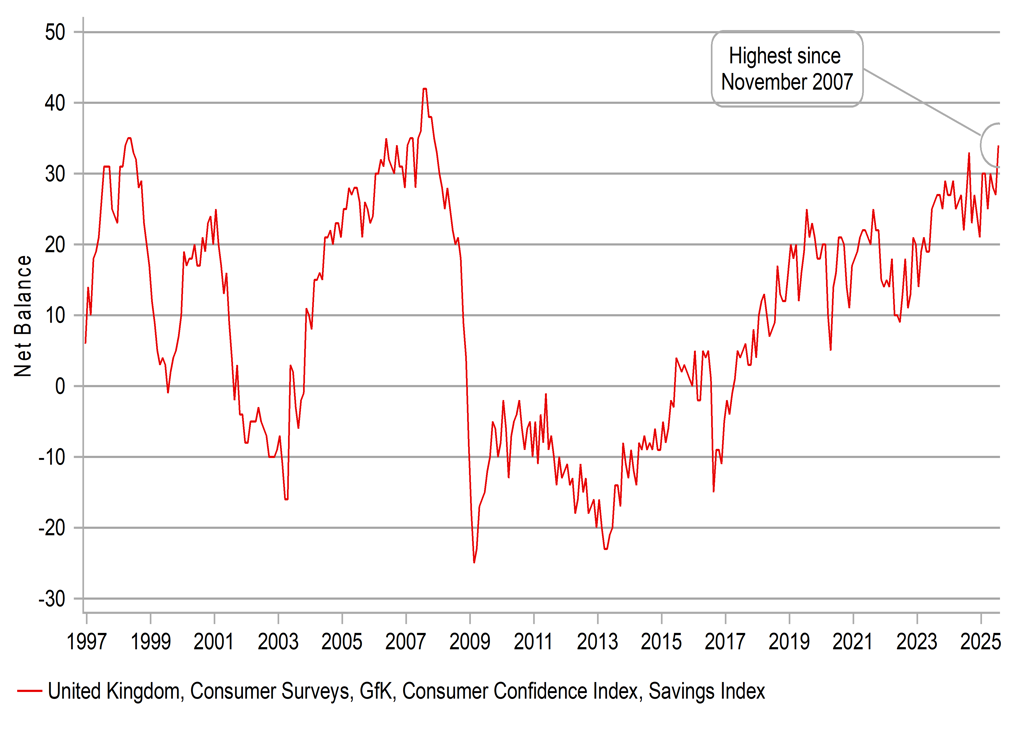
The pound got off to a bad start in July with speculation that Chancellor Reeves could be fired fuelling a surge in Gilt yields and a sharp sell-off of the pound. Reeves going wasn’t necessarily the issue but speculation of a more left-leaning Chancellor (Pat McFadden) fuelled fiscal slippage concerns. The episode highlighted how vulnerable the UK remains to weak growth, leading to missed fiscal targets, leading to tax increases and further weak growth. A debt doom-loop is an increasing concern and the negative correlation between GBP on a trade-weighted basis and 30-year Gilt yields remains more sustained in negative territory than in either the US or Japan. The scrapping of the cuts to welfare spending due to a Labour party rebellion means more tax rises lie in wait when the next budget update is scheduled in the autumn. That widely expected development is prompting UK consumers to save more. The GfK Consumer Confidence report revealed savings intentions amongst consumers reached the highest level since November 2007, just as the GFC was beginning to unfold. The lack of clarity in fiscal policy is also likely to undermine businesses capital investment planning.
That consumer caution was highlighted by the much weaker retail sales for June. After a 2.9% plunge in May, the volume of sales increased a modest 0.6%, weaker than expected. GDP is set to stall in Q2. Expectations had been building that the MPC could up its pace of easing but the labour market data saw some of the PAYE employment weakness revised away. Wage growth remains stickier with the 3mth YoY growth rate at 5.0% in May, 0.1ppt higher than expected. That and stronger CPI data means the MPC is set to continue with its “gradual and careful approach” to further monetary easing. This mix of higher than anticipated inflation and weakening economic growth is an unfavourable mix for the pound. While a rate cut in August is highly likely the pace is set to remain quarterly. The September MPC meeting will also include fresh guidance on QT policy and it is highly likely that the MPC will signal a slowing of the pace of Gilts coming off the balance sheet from GBP 100bn to perhaps GBP 60bn, or even potentially GBP 50bn. That smaller amount is roughly equivalent to the Gilts due to roll off the balance sheet and would therefore imply no outright sales of Gilts, which would help save the government money.
The continued gradual easing by the MPC but weak growth and uncertainty over the UK’s fiscal position will likely see the pound underperform against many other G10 currencies but still advance versus the dollar. EUR/GBP is set to drift higher with the BoE having more easing to do over the forecast period.
INTEREST RATE OUTLOOK
|
Interest Rate Close |
Q3 2025 |
Q4 2025 |
Q1 2026 |
Q2 2026 |
|
|
Policy Rate |
4.25% |
4.00% |
3.75% |
3.50% |
3.25% |
|
3-Month Bill |
4.27% |
3.95% |
3.70% |
3.45% |
3.25% |
|
10-Year Yield |
4.57% |
4.55% |
4.50% |
4.35% |
4.30% |
* Interest rate assumptions incorporated into MUFG foreign exchange forecasts.
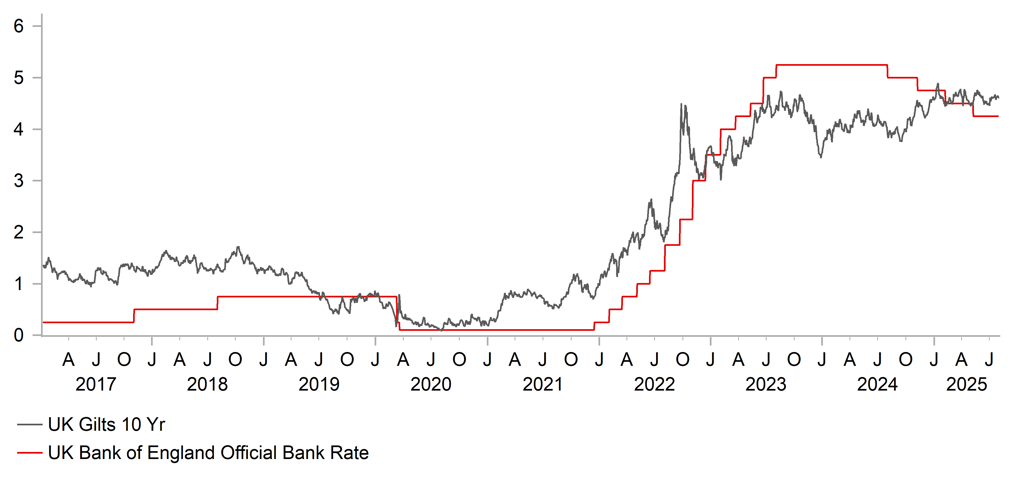
The 10-year Gilt yield jumped in July, by 8bps to close at 4.57%. The big move came at the start of the month with the government scrapping cuts to welfare spending and speculation of Chancellor Reeves being replaced by someone more eager to loosen fiscal policy further. The 10-year Gilt yield has generally remained in a 4.40% - 4.80% since February and we continue to favour that range holding but ultimately yields breaking below the downside of that range. The issues keeping yields under upward pressure and within that range are sticky services inflation and wage growth that remains too slow in declining. Still, enough progress is being made, despite being slow, for the MPC to cut at the August meeting but maintain the “gradual and careful approach” to monetary easing. The MPC is monitoring closely for the “slack opening” in the jobs market that will increase confidence over slower wage growth and hence inflation. The unemployment rate increased to 4.7% in May, the highest since June 2021 (or Jan 2017 ex-covid). Longer-term yields should be helped lower by the slowdown in QT that is likely to be confirmed in September. An annual reduction of GBP 50bn, down from GBP 100bn would imply no outright sales from the BoE.
UK CUSTOMER CONFIDENCE INDEX
Source: Bloomberg, Macrobond
BOE POLICY RATE, % VS. UK 10 YR GILTS, %
Source: Bloomberg, Macrobond
Chinese renminbi
|
Spot close 31.07.25 |
Q3 2025 |
Q4 2025 |
Q1 2026 |
Q2 2026 |
|
|
USD/CNY |
7.1990 |
7.2000 |
7.2500 |
7.2000 |
7.1500 |
|
USD/HKD |
7.8499 |
7.8490 |
7.8490 |
7.8400 |
7.8400 |
|
Consensus |
Consensus |
Consensus |
Consensus |
||
|
USD/CNY |
7.1700 |
7.1500 |
7.1300 |
7.1100 |
|
|
USD/HKD |
7.8300 |
7.8000 |
7.8000 |
7.8000 |
MARKET UPDATE
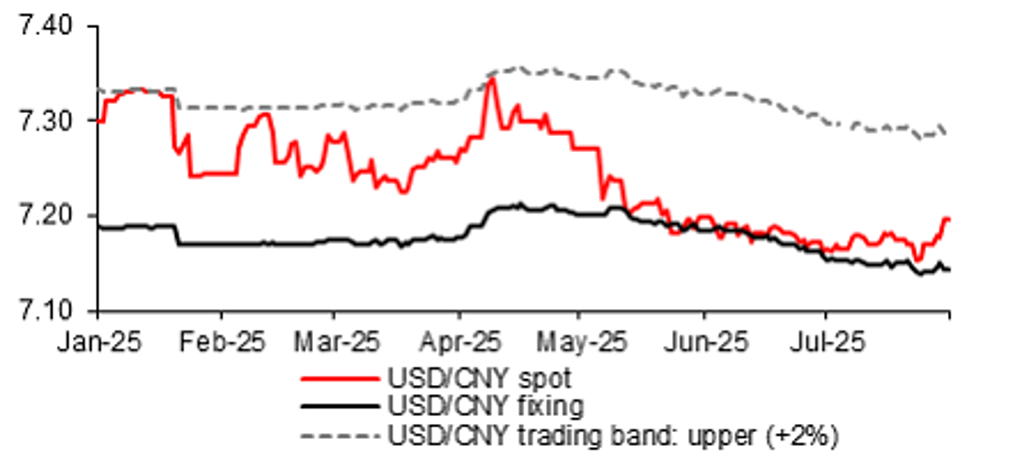
In July, USD/CNY moved from 7.1637 to 7.1990. On 21st July, the PBoC kept the 1Y and 5Y LPR at 3.00% and 3.50% respectively as expected. On 14th July, the central bank reiterated that it would “control the pace and intensity of policy implementation” in implementing a moderately loose monetary policy, the same term used in the summary of its Q2 quarterly monetary policy committee meeting from previously “cutting RRR and interest rate at appropriate times”.
OUTLOOK
For 1H this year, China’s economy grew at a solid pace of 5.3%yoy, above the annual target of 5.0%. It was supported by stronger-than-expected Q2 growth of 5.2%yoy, partly thanks to resilient exports and continued front-loaded government bond issuance. That said, lower nominal GDP growth of 3.9%yoy widened the GDP deflator to -1.3%yoy in Q2 from Q1’s -0.8%yoy, highlighting intensified deflationary pressures. While the readout of July’s Politburo meeting confirmed the plan to hold the fourth plenum of the 20th CCCPC in October with the main focus on discussing 15th Five-Year Plan, it also sent a strong signal of cracking down on “involution”, with the mention to “address disorderly competition among enterprises”, “regulate key industry capacity” and “standardize local government’s behavior in attracting investment”. In addition, what is explicitly absent compared to April’s readout was the pledges to further stabilize the property sector, with merely a reiteration of urban renewal. It appears that the housing sector is not among the government’s top priorities in the near-term, and instead the focus may be on promoting social welfare and providing livelihood support to those needed, among others, to stimulate consumption. For instance, last month, the government introduced a nationwide childcare subsidy program starting in 2025, offering RMB 3,600 per year for each child under three years old. Separately, the State Council is planning to roll out free pre-school education gradually, urging local governments to draw implementation plans and allocate subsidies accordingly.
Major tariff announcements in July led to a minor tweak in our USD/CNY forecast from 7.25 to 7.20 by Q3. The final tariffs on EU and Japan are less than previously thought, tariffs on main Asian economies are reduced to largely around 20%, and 15% for South Korea and Japan. Overall, these offered a “positive surprise”, implying a lesser drag on China’s exports and growth. It is likely that the US will confirm another 90-day tariffs pause. This and the uncertainty over Trump’s threat to impose 100% tariffs on countries that purchase Russia’s oil, could create a modest front-loading demand for China’s goods in the near-term, and may help to temporarily offset part of the negative impact of the current 41% US tariff on China (we expect final tariffs to be about 40%). Nevertheless, we maintain our view of GDP growth to slow in the coming quarters (to 4.7%yoy in Q3, 4.1%yoy in Q4), and still expect USD/CNY to reach 7.2500 by Q4. A likely renewed depreciation of the US dollar in 2H could help to offset some stress on the currency.
INTEREST RATE OUTLOOK
|
Interest Rate Close |
Q3 2025 |
Q4 2025 |
Q1 2026 |
Q2 2026 |
|
|
LPR 1Y |
3.00% |
2.80% |
2.60% |
2.60% |
2.60% |
|
7-Day Repo Rate |
1.40% |
1.20% |
1.00% |
1.00% |
1.00% |
|
10-Year Yield |
1.71% |
1.65% |
1.55% |
1.65% |
1.75% |
* Interest rate assumptions incorporated into MUFG foreign exchange forecasts.
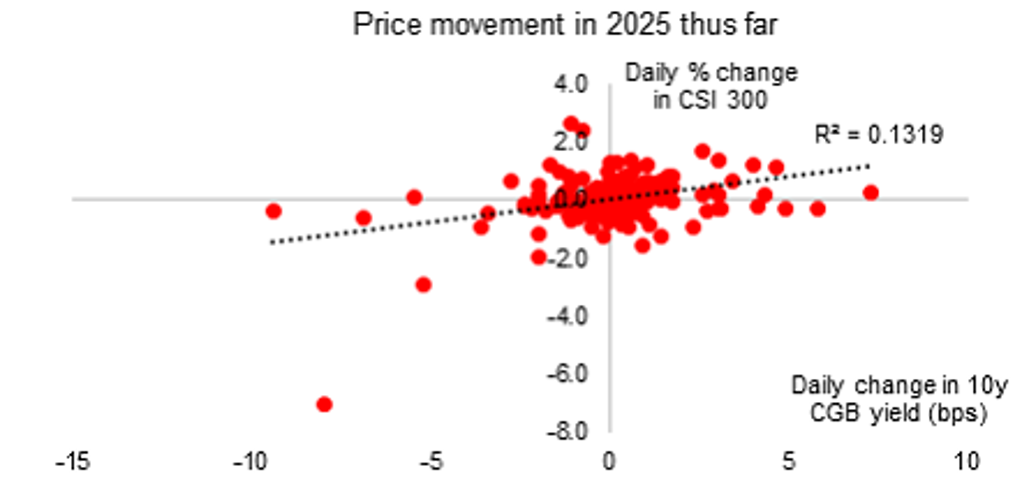
China’s 10y CGB yield experienced a steady rise to as high as 1.75% from 1.65% previously at the end of June before paring some gains and ending the month at 1.71%. The rally in the 10y CGB yield could be helped by the government’s growing focus on cracking down on “involution” which relates to curbing excessive price competition and investors’ switching out of bond investments and investing more in equities, influenced by the recent strong CSI 300 performance (which increased by 3.5% in July). While we agree addressing overcapacity in emerging industries like solar and EV for instance may help to alleviate price pressures on upstream and overall producer prices (PPI), a sluggish consumer end-demand is the main reason behind the weak CPI index. With no significant improvement in (or prospect of) wage growth and employment, the anti-excessive-competition slogan can hardly translate into a meaningful reflation improvement, in our view. Combined with a loose liquidity condition, room for further monetary easing, as well as relatively less government bond supply pressure in 2H (heavy front-loading in 1H), we expect the 10y CGB yield to move lower to 1.65% by end-Q3 and 1.55% by year-end.
PBOC’S STRONGER USD/CNY FIXING LIMITED CNY WEAKNESS IN JULY
Source: : Bloomberg, MUFG GMR
10Y CGB YIELD IS POSITIVELY CORRELATED WITH CSI 300 PERFORMANCE
Source: : Bloomberg, MUFG GMR
