

USD/JPY: How long will the current range hold?
Week in review
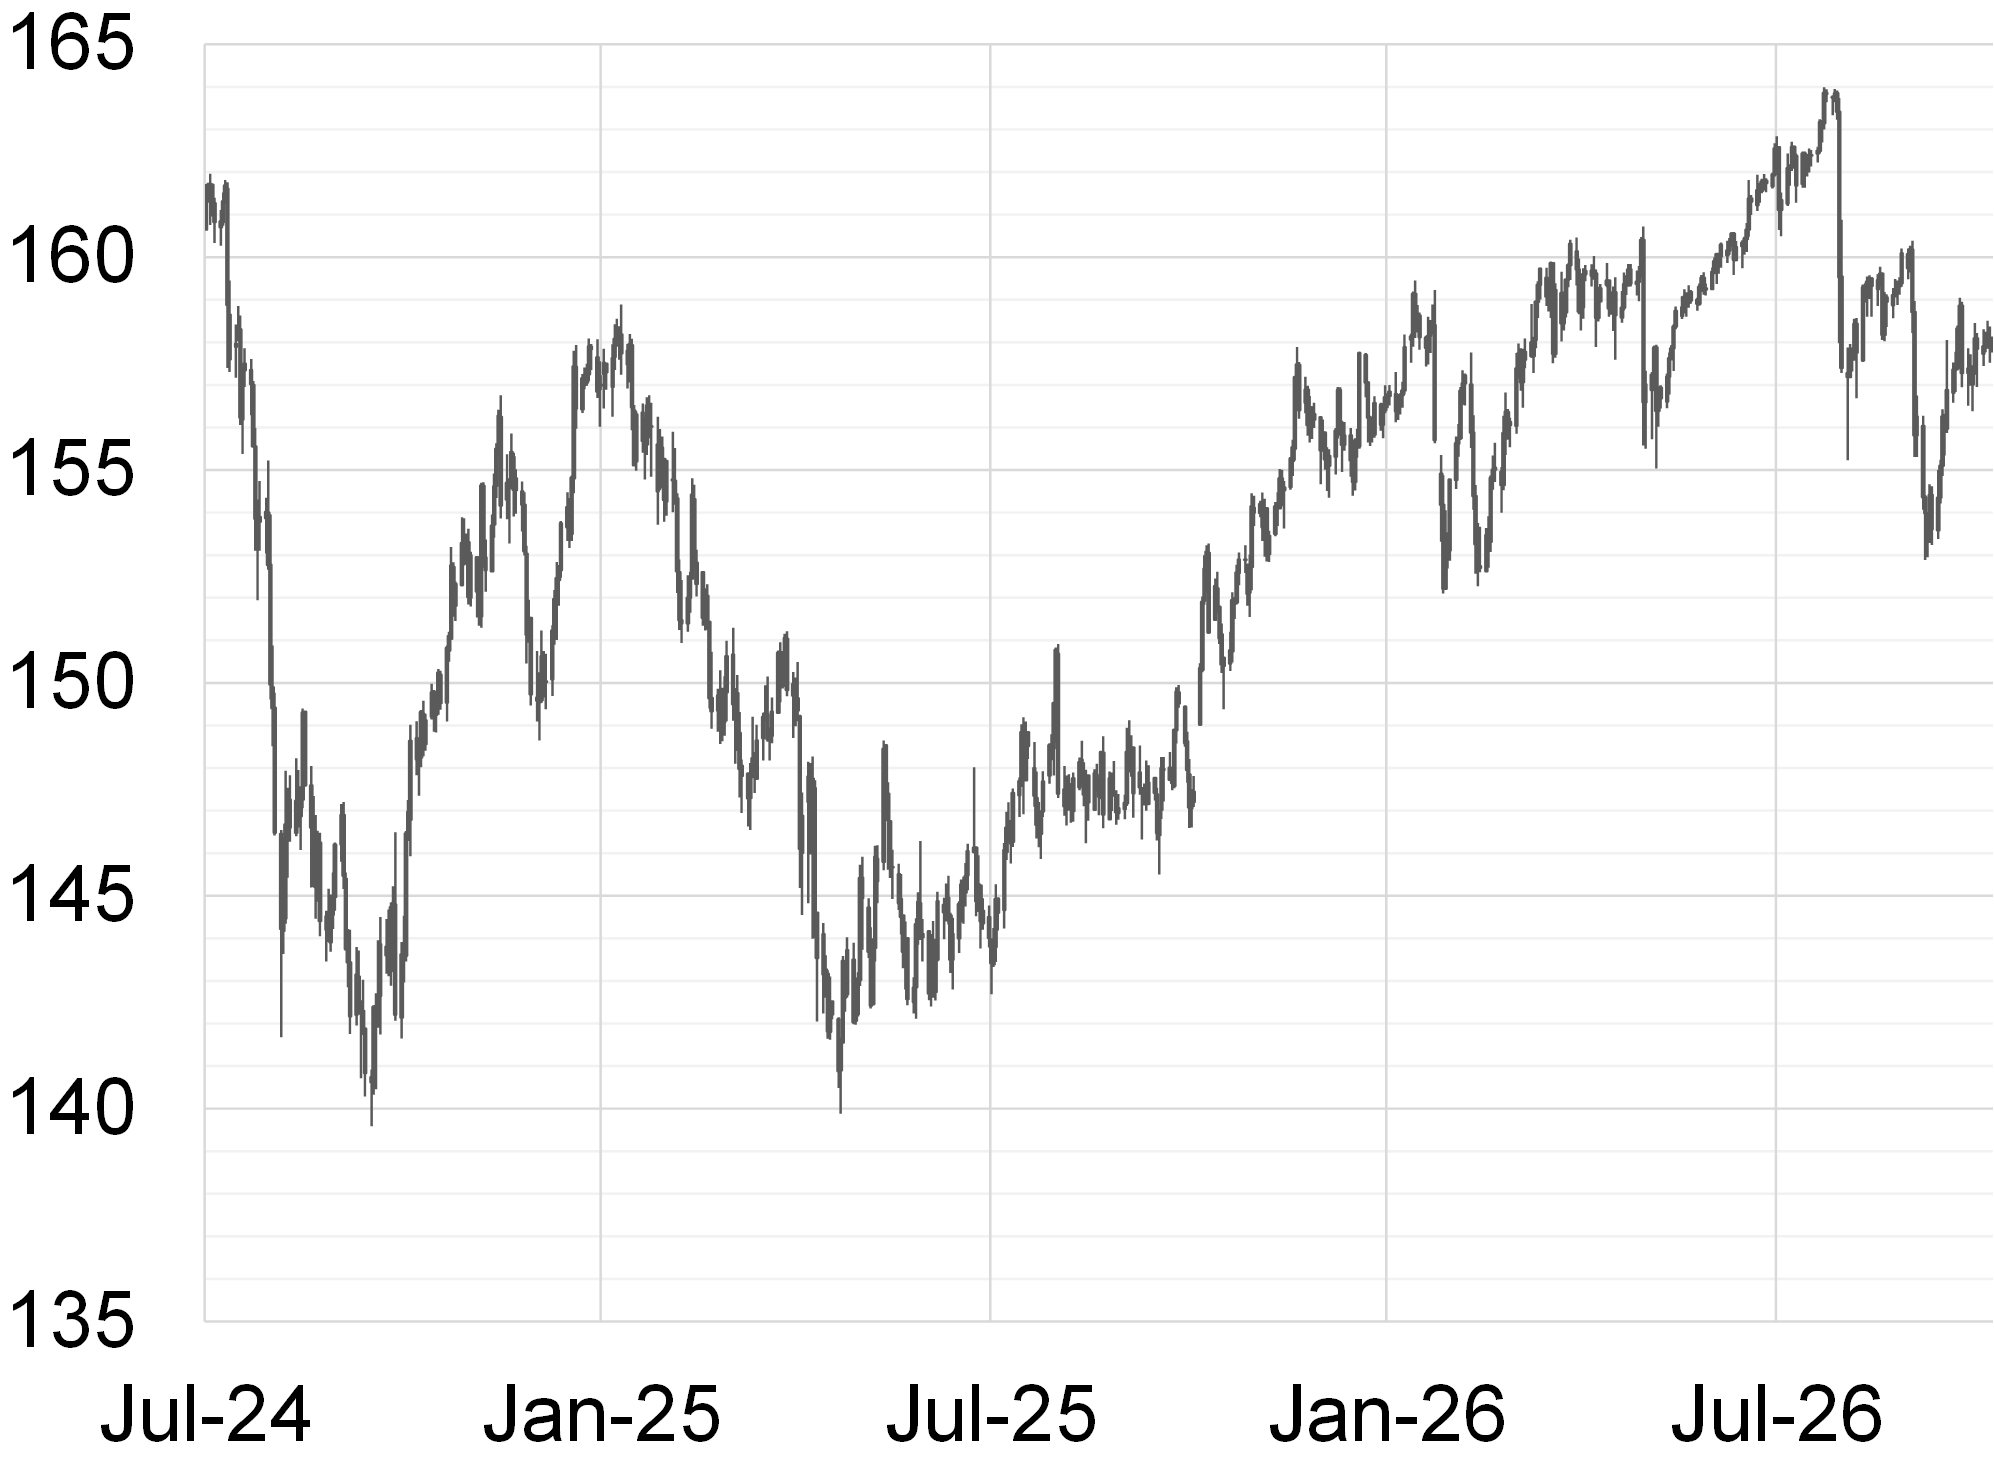
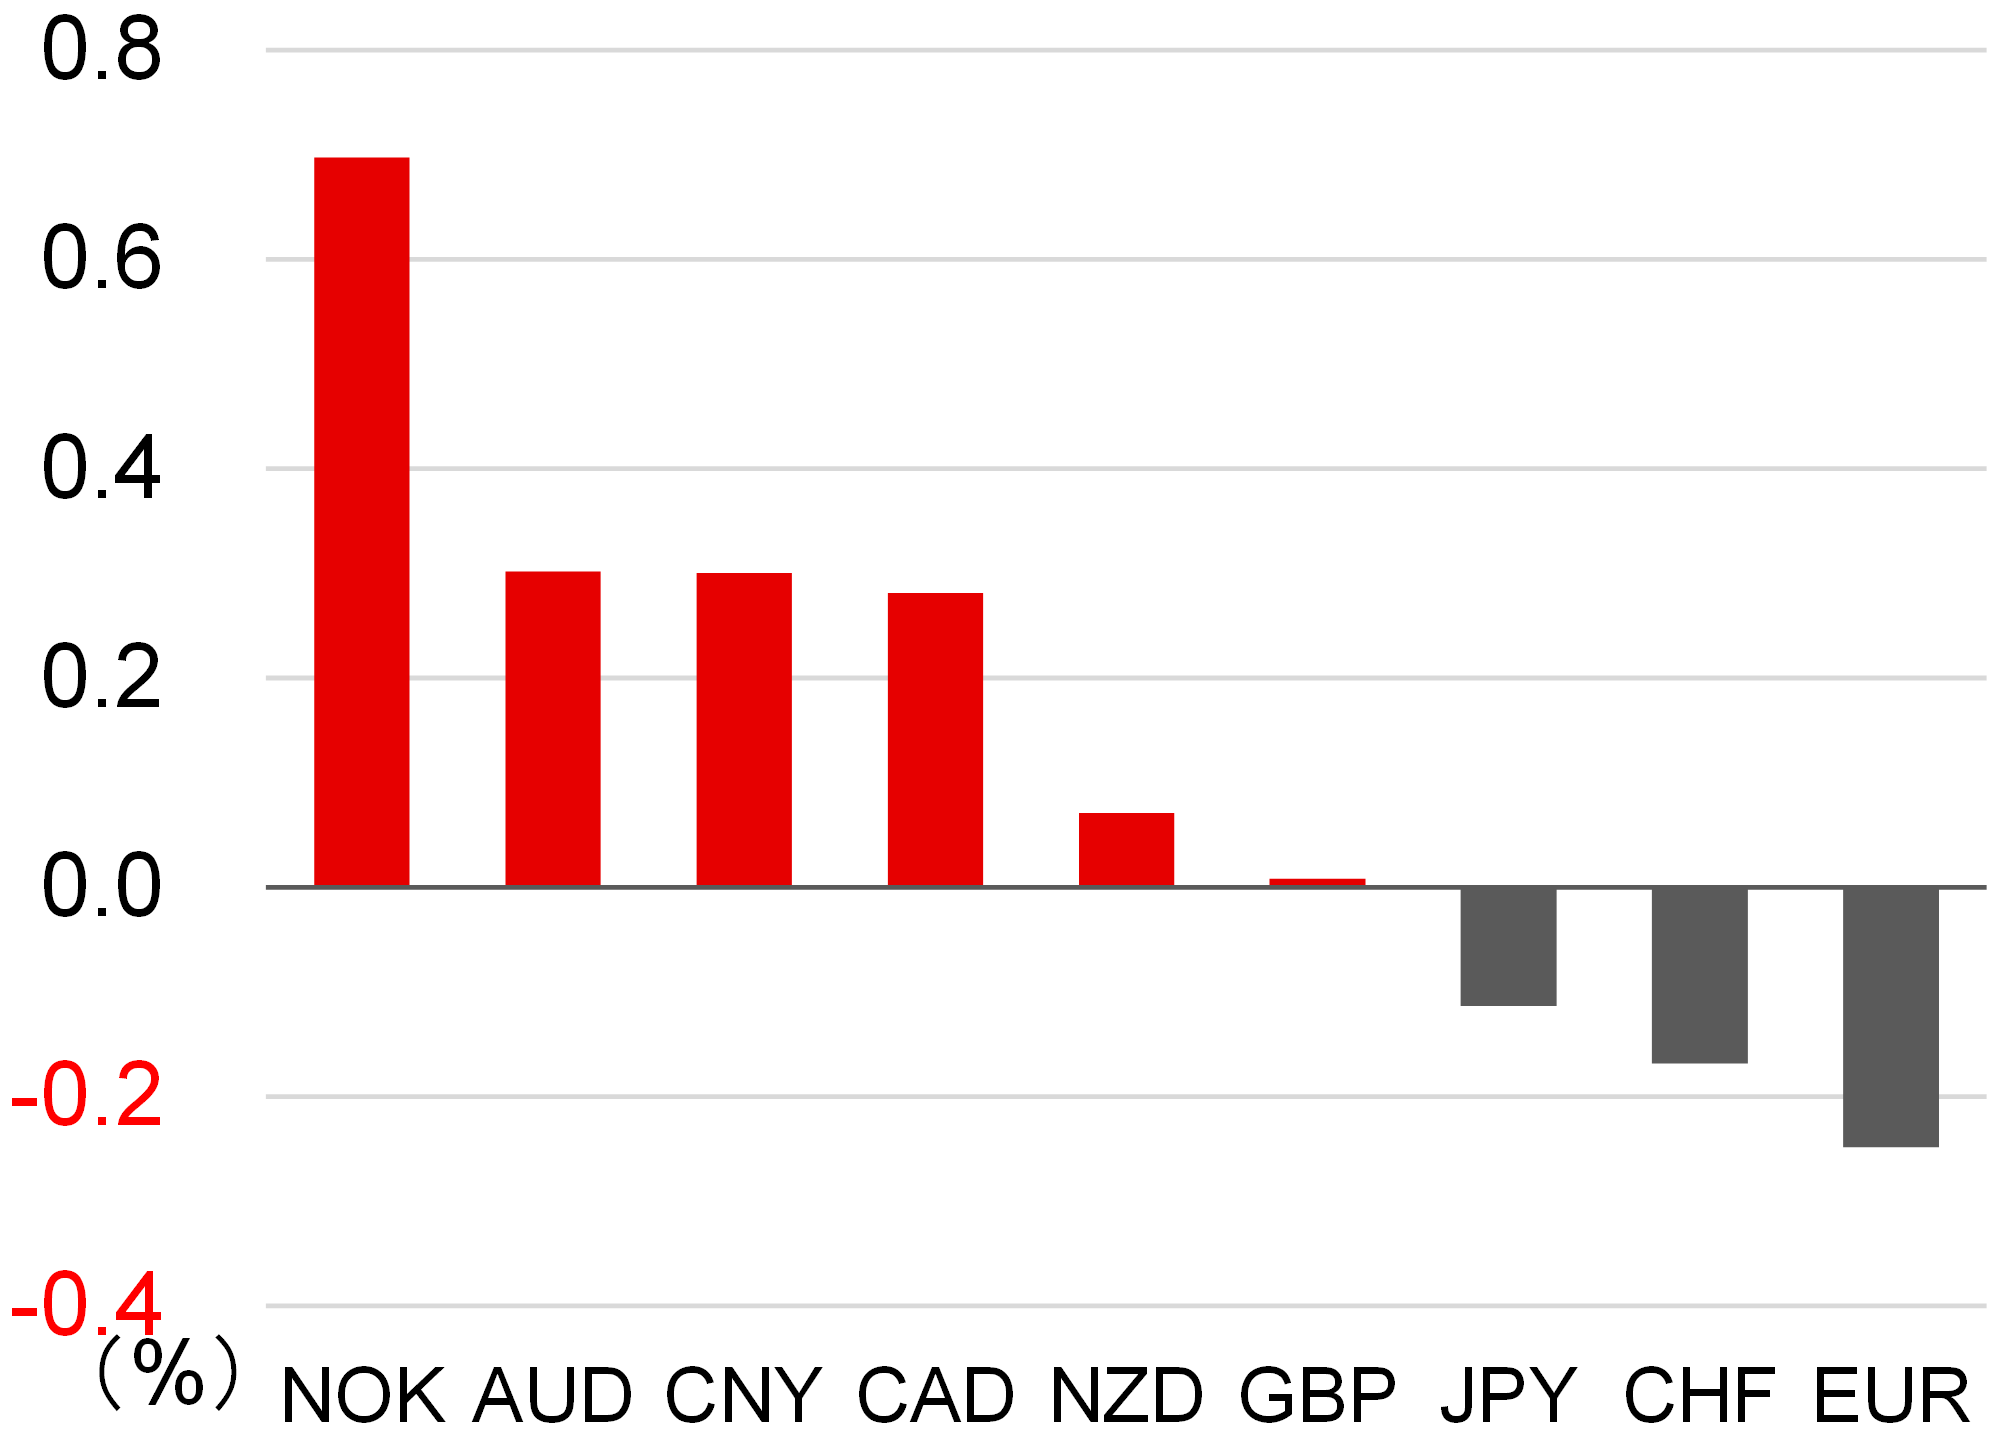
The USD/JPY opened the week at 157.73 then edged steadily higher, reaching around 158.50 in early trading on 7 October. The pair struggled to extend its gains, with the 200-day moving average around that level acting as resistance, and fell back to around 157.50 by the morning of 8 October. The USD/JPY subsequently moved around 158, then fell to around 157.50 during US trading after President Donald Trump ruled out an attack on Iran before the midterm elections. However, the decline was short-lived, and the pair was trading around 158 as of writing on 9 October (Figure 1). Speculation that the US would resume attacks on Iran intensified in the first half of the week, supporting crude oil prices. Commodity-linked currencies consequently outperformed on a relative basis (Figure 2).
FIGURE 1: USD/JPY
Note: As at 13:00 JST on 9 October
Source: EBS, Refinitiv, MUFG
FIGURE 2: MAJOR CURRENCIES' RATE OF CHANGE VS USD THIS WEEK
Note: As at 13:00 JST on 9 October
Source: Bloomberg, MUFG