

To read the full report, please download PDF.
USD can advance further
FX View:
The USD has strengthened further this week with DXY breaking above the 103-level to reach the highest level since April 2025. The move was fuelled by the jump in yields following the stronger than expected CPI data for October. The move will likely bring renewed focus on FX policy in Tokyo with USD/JPY breaking above the 160-level. We’d assume intervention at some point between this level and the most recent high earlier this year at 164.00. This week we look at JPY flows to analyse what might be behind the continued support beyond yields that looks less reliable as a driver as before. Large unhedged NISA-related outflows is certainly a factor and key to engineering a more sustained turnaround in USD/JPY will rest on how successful the government will be in encouraging greater investments in domestic assets. We also look at the Australian dollar given the poor performance so far this month. The potential end of the RBA tightening cycle and the drop in energy prices look to be primary factors although AI sentiment is not helping.
BROAD-BASED GAINS ACROSS G10 FOR THE USD THIS WEEK
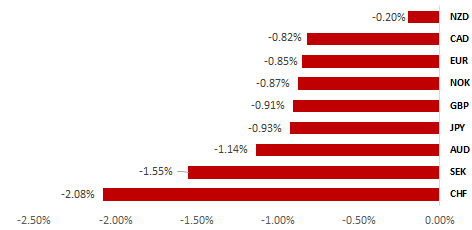
Source: Bloomberg, as of 13th November 2026 14.30 GMT (Weekly % Change vs. USD)
Trade Ideas:
We are recommending a new short AUD/JPY trade idea and closing short EUR/JPY and NOK/CHF trade recommendations.
JPY Flows:
The Transactions in International Securities data for October revealed substantial buying of Japanese securities by foreign investors.
FX Options Monitor:
USD/JPY option flows highlight that market participants are buying cheap "disaster insurance" to protect against the possibility of a sudden, extreme shock such as an intervention.
FX Views
JPY: Sticky outflows should become less sticky
The 45bp jump in the 2-year UST bond yield this week has reinforced positive momentum for the US dollar that has quickly brought USD/JPY back to the 160-level – above where the threat of intervention will certainly be a lot higher. The rhetoric implying that threat is increasing has picked up notably in recent days with both Finance Minister Katayama and Vice Finance Minister Mimura indicating FX moves of late have been too rapid. But despite the rhetoric there will be inevitable doubts over the resolve to fight US dollar strength when the move is being fuelled by a surge in front-end rates in the US. There have been two periods of intervention this year – at the turn of the months in April/May and Jul/Aug. Between those two periods, US front-end yields did also rise, by 55bps on an intra-day low to high basis. On this occasion the move has been more substantial – 86bps on a same intra-day low to high basis and currently the increase stands at 75bps. Of course, a lot of that increase is captured in recent days and that could make the authorities more cautious over the short-term, but we doubt it will result in the MoF abandoning the intervention strategy. The rhetoric does have some impact – all of G10 is weaker versus the dollar this week, but the yen is outperforming most of the rest of G10 with only NZD and EUR outperforming JPY.
We have highlighted recently some of the negative yen flows that persist that help explain the continued resilience of USD/JPY despite bigger moves in rate spreads that imply USD/JPY should be a lot lower. Covering a 5-year period since the end of covid / start of the global inflation shock, the US- 2-year spread implies USD/JPY should be closer to 140.00, not 160.00. But over the last 12mths, the US-JP spread is now at the highest level implying upside scope for USD/JPY. What’s clear is the spread as a driver of FX is less reliable. Outflows from Japan retail on the equity side have been huge as a standalone flow relative to other institutional flows. Why look at this flow in isolation? We know these flows are largely unhedged whereas other institutional outflows are hedged to much greater levels. Since the NISA account limit was tripled, effective the start of 2024, foreign equity purchases has totalled JPY 29.7trn (USD 194bn @ USD/JPY average over that period). By comparison, total Japanese investor purchases of foreign bonds over the same period totalled JPY 12.5trn and total equity purchases were JPY 2.0trn. The big divergence reflects heavy foreign equity selling by Japan Trusts (pension/real money funds) but that was a switching flow from equities into foreign bonds. So within the total flow data sits a very large unhedged outflow.
The tripling of the NISA account size limit is an important factor of course in this increased flow but in addition Japanese households, need to enhance returns to protect savings in real terms has become far more important due to the pick-up in inflation after years of mild deflation. Headline nationwide CPI averaged 2.9% in the four years to 2025 and is expected to be 2.0% in 2026. The latest BoJ data on household financial assets is as of Q1 2026 and reveals that 47.2% of Japanese household assets are in cash deposits, compared to just 10.7% in the US and 31.1% in the euro-zone. In yen terms, cash deposits equates to JPY 1,126 trillion, or USD 7.04 trillion (@160 USD/JPY). For Japan to gradually adjust to the euro-zone level of cash deposits would imply USD 2.38trn of new investments.
RATE SPREAD / USDJPY CORRELATION IS WEAKER
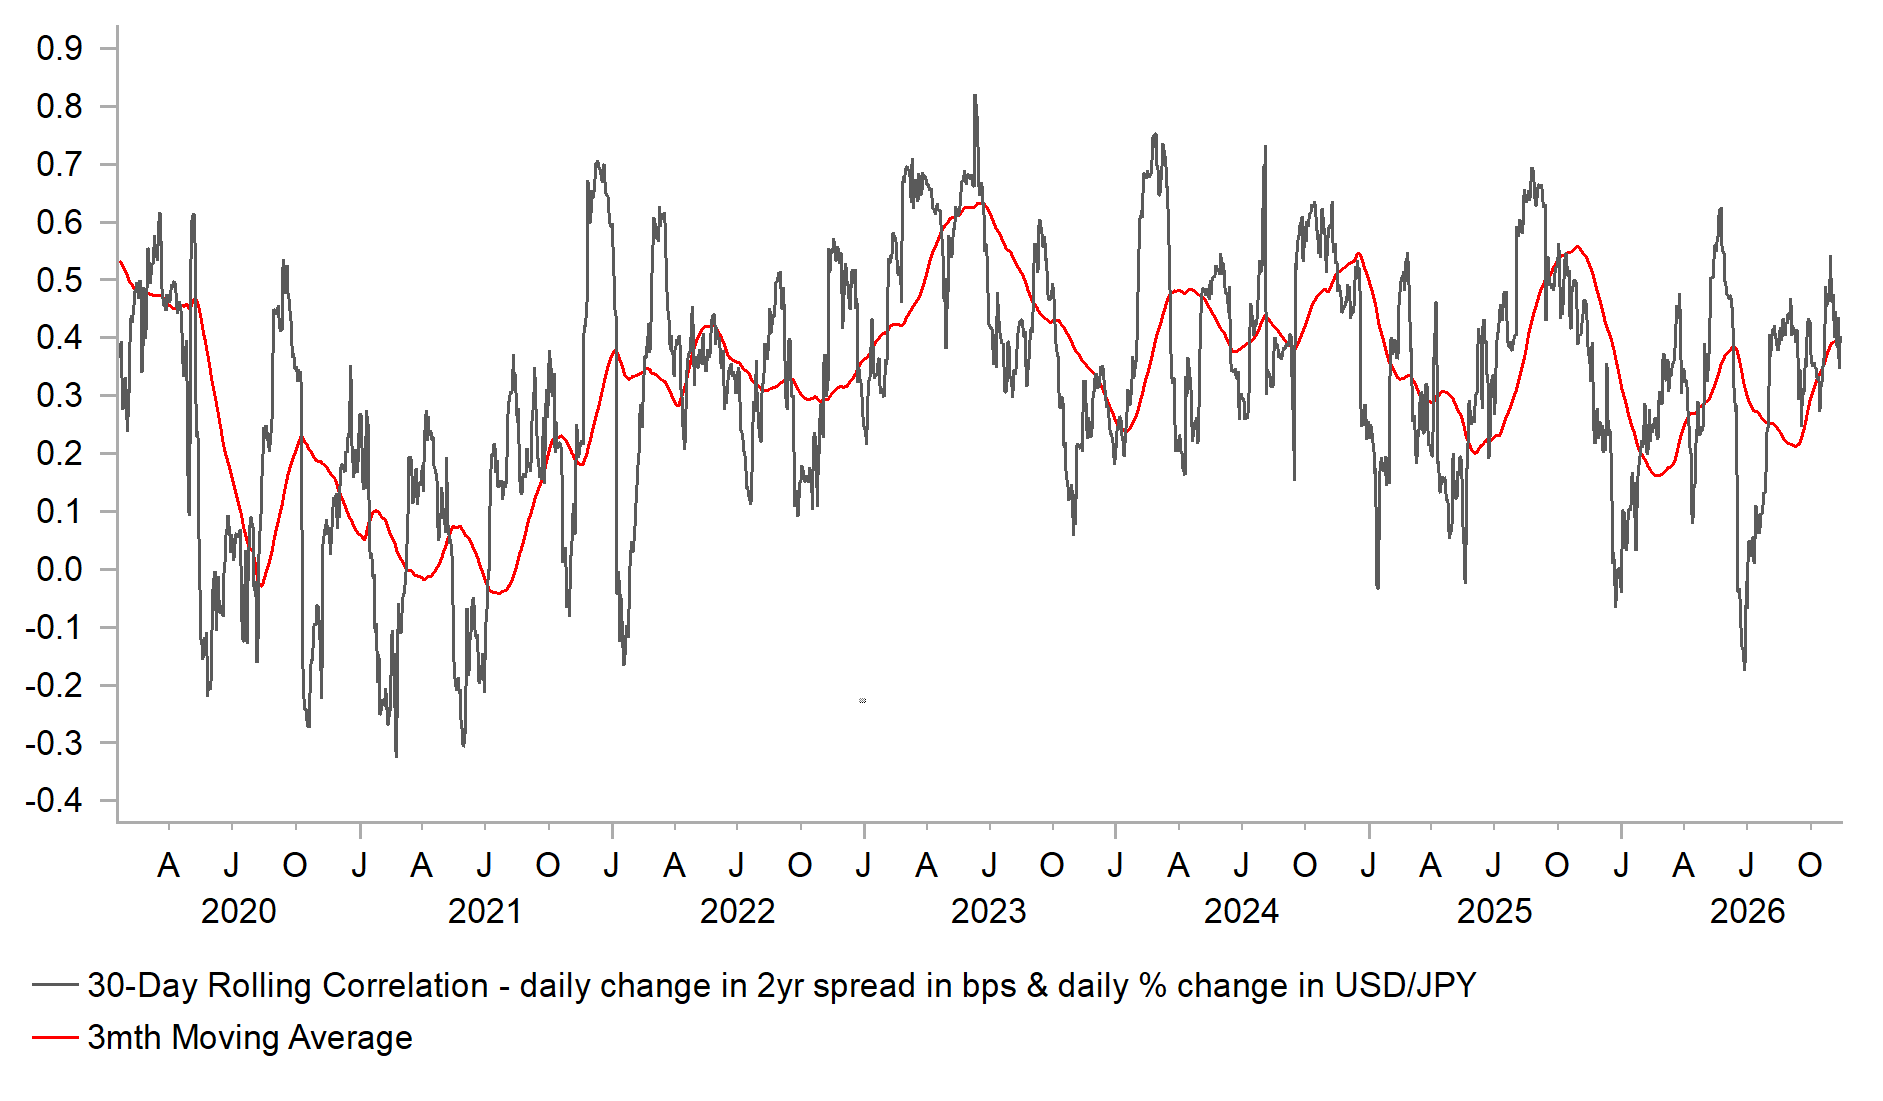
Source: Bloomberg, Macrobond & MUFG GMR
NISA LIMIT TRIPLED HAS SEEN LARGER OUTFLOWS
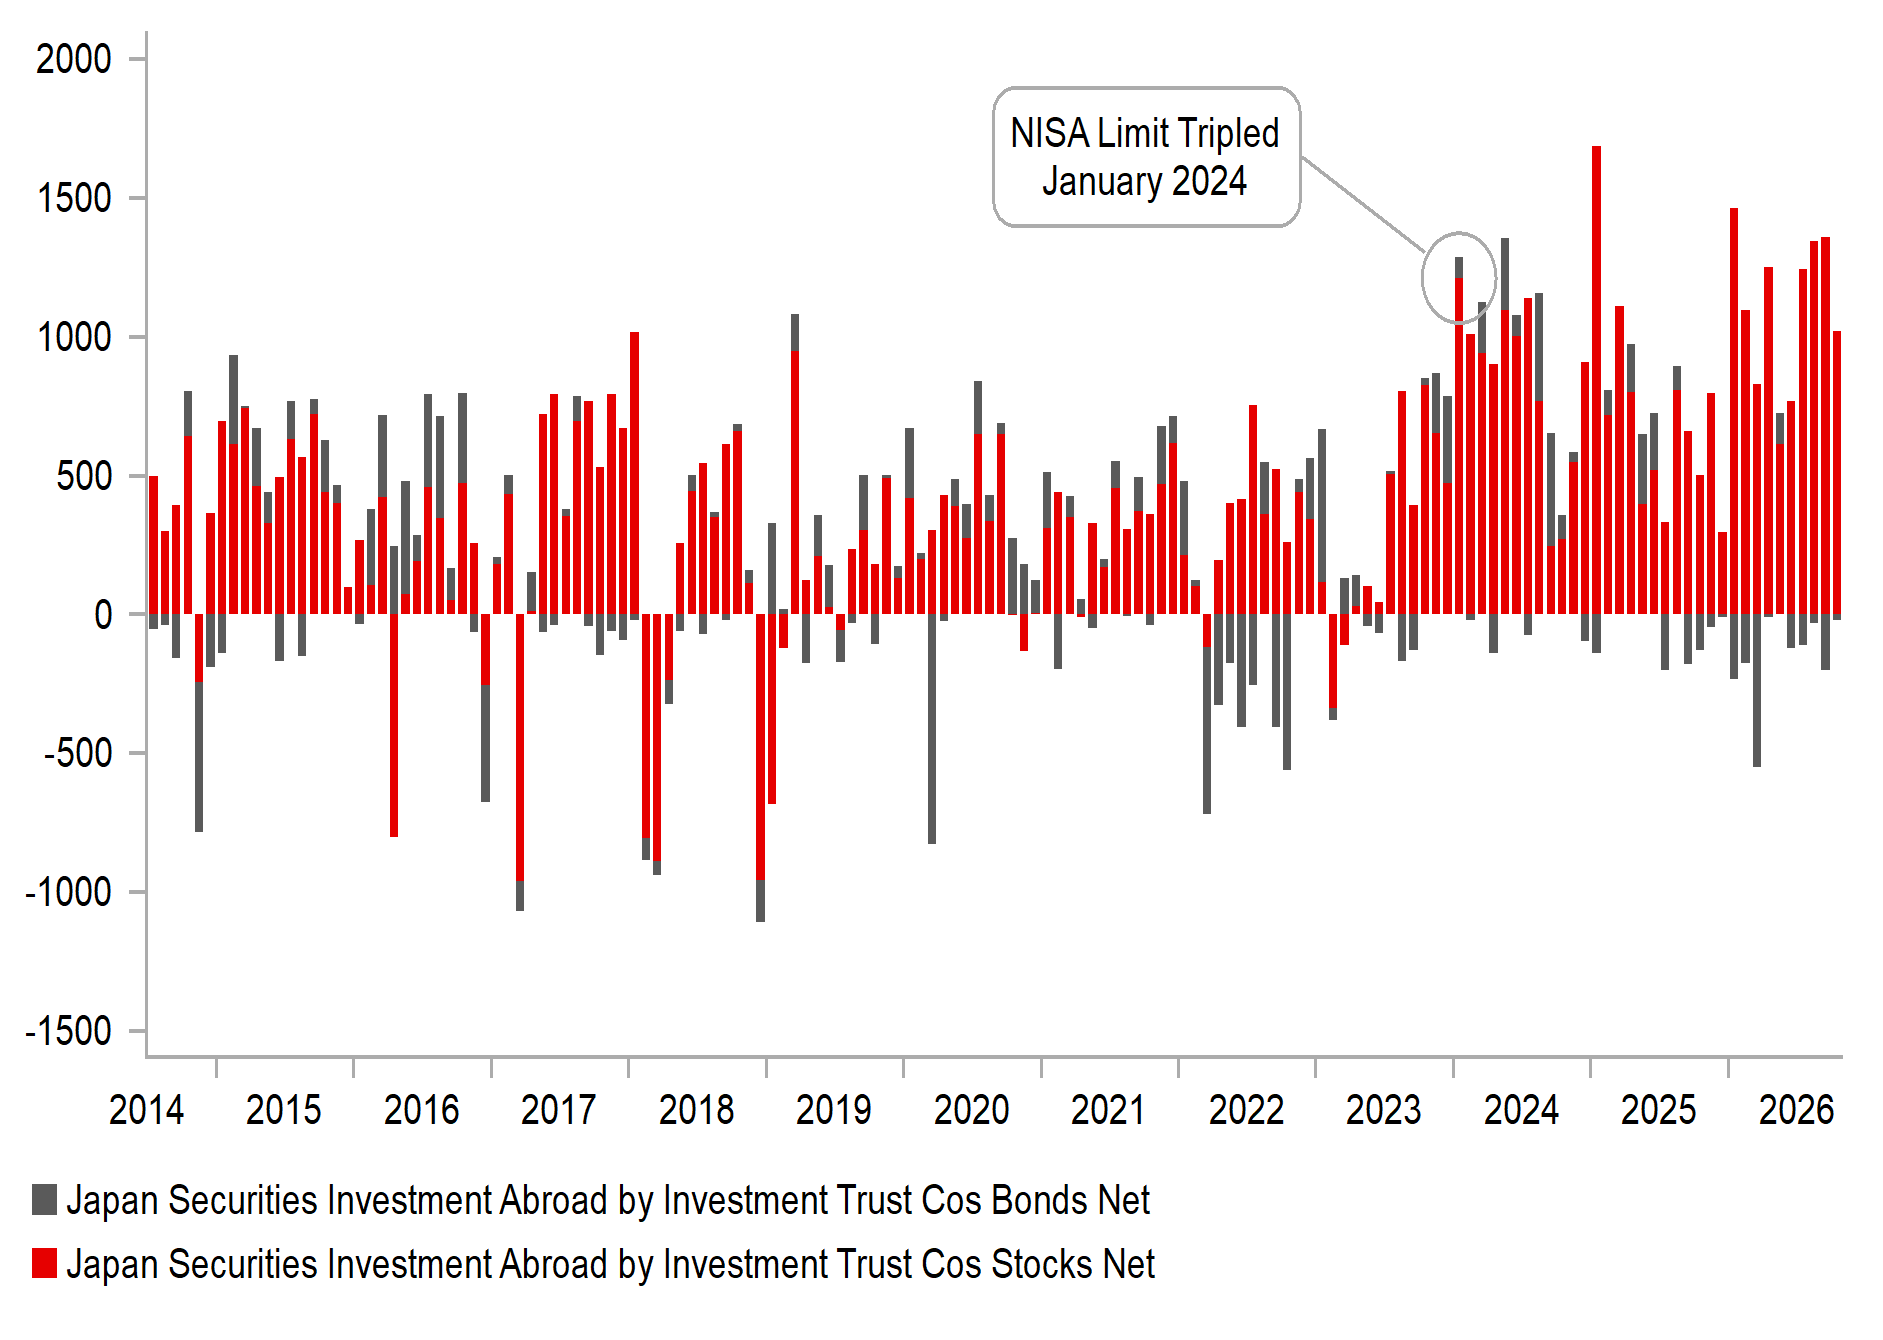
Source: Bloomberg, Macrobond & MUFG GMR
That’s a potential sizeable shift over time that could continue to flow from Japan and keep the yen under downward pressure. In this context, the government is set to try and incentivise more investments in domestic assets. Firstly, there are discussions over including individual JGB holdings in NISA accounts and removing JGB holdings from inheritance tax. Higher yields in JGBs now mean there is a credible alternative to foreign assets. Adding tax incentives would certainly see a notable pick-up in demand. That’s happening already as was illustrated in MoF data on individual JGB flows. To meet demand, the government issued JPY 2,026bn of JGBs to individuals this month, the largest total on record. There has been a marked upturn in demand from individuals since August, with three record totals in the last four months. Institutional flows have not shown any marked upturn in demand for domestic securities. GPIF flows, captured under Japan Trust flows have continued to invest abroad with switching from foreign equities to bonds the main flow. An increase in the weighting of domestic bonds still looks likely given the government’s policy objective and that could then see increased institutional demand for JGBs. Preliminary Q2 data shows household assets in investment trusts, equities and debt securities at 28% of total (up from 25.1% in Q1) and the government wants to raise this to 40% by 2040. That would place Japan on a par with the euro-zone but still well behind the US. Working on changes to encourage greater domestic investments via NISA accounts will be key for the government. The number of NISA accounts in Japan hit 30mn at the end of June, which accounts for 27.4% of the over 15yrs population. The government target is 34mn in 2027.
With USD/JPY through the 160-level the threat of intervention will increase and at some point between here and the recent pre-intervention high of 164.00 will likely be where yen buying intervention will take place again. But government policy initiatives to encourage domestic investments will be important. Under Abenomics the government’s push to encourage greater risk taking and investments abroad to enhance returns was very successful. Whether the current government’s push to invest more at home will be successful will be important in halting the trend of yen weakness.
JGBS BOUGHT BY JAPANESE INDIVIDUALS
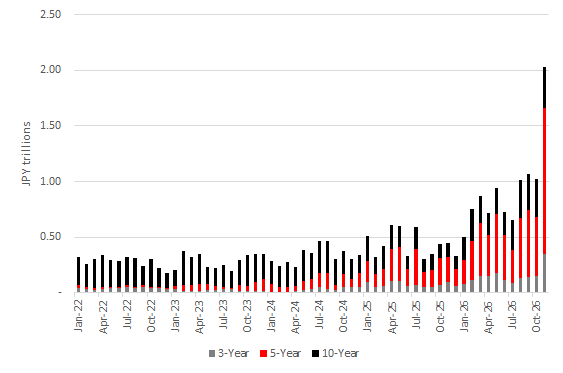
Source: Bloomberg, Macrobond & MUFG GMR
JAPAN TRUSTS HAVE BEEN ASSET SWITCHING
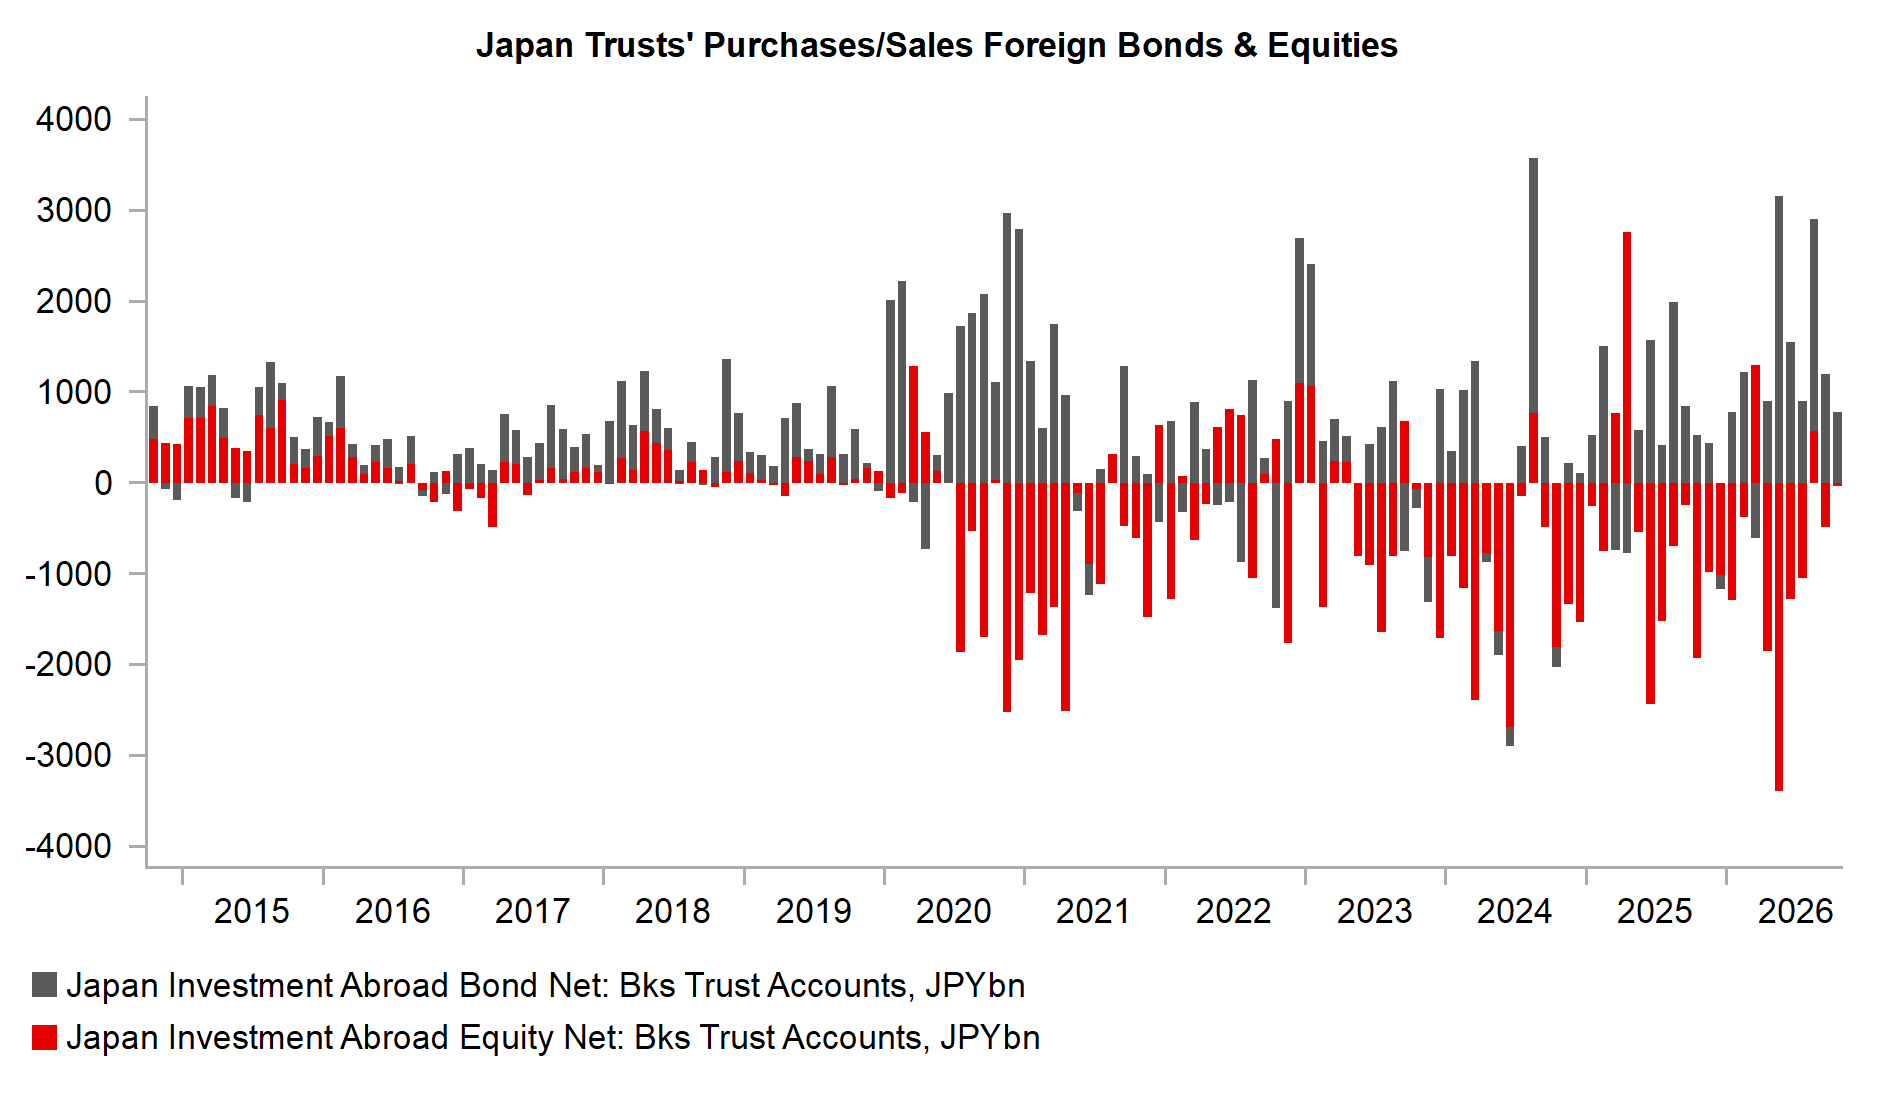
Source: Bloomberg, Macrobond & MUFG GMR
AUD: What has been driving the reversal of gains from earlier this year?
The USD has been the best-performing G10 currency over the past week, pushing the dollar index to fresh year-to-date highs above the 103.00 level. The move has been broad-based, with USD gains most pronounced against the CHF, SEK and AUD, while the NZD has been the notable exception, showing greater resilience. The renewed upward momentum in the USD has been driven primarily by an abrupt hawkish repricing of Fed rate hike expectations. Reflecting this shift, the 2-year US Treasury yield has rebounded by around 44bps from its low at the start of the week, moving back towards the year-to-date high of 4.96% reached on 29th September.
Market participants have moved to price in a more aggressive Fed tightening cycle following the third consecutive upside surprise in US core CPI in October and a hawkish shift in Fed rhetoric. Fed officials have signalled that a faster pace of rate hikes may be required heading into the winter. As a result, the US rates market is now assigning a higher probability to three consecutive hikes in December, January and March, which would lift the effective Fed funds rate towards 4.6%. Fed Governor Waller has gone a step further, indicating that he is considering voting for a larger 50bps hike in December, although we do not expect such a move to garner broad-based support. The last 50bps Fed hike came in December 2022, when the Fed funds rate was at the same level as it is today. Importantly, however, underlying inflation pressures were considerably more elevated at that time. Core CPI had risen at an annualized rate of 6.2% in the six months to October 2022, compared with 2.7% in October 2026.
Recent inflation readings were boosted by the sharp rise in energy prices between September and October, when oil prices increased by just over 30% to return to year-to-date highs. That move has since partially reversed, with oil prices falling by almost 20% this month. If sustained, lower energy prices should help to ease inflation pressures in the months ahead. The sharp reversal has been encouraged by renewed investor optimism over the prospect of a US-Iran deal following the Republicans' damaging defeat in the US mid-term elections. Encouragingly, the IEA's latest Oil Market Report, released today, also pointed to tentative signs of rebalancing in the oil market. Global supply is now exceeding demand for the first time since the outbreak of war in Iran, with the IEA expecting the market to move back into surplus in Q4 and larger surpluses to emerge in 2027, subject to supply disruption risks. Global oil supply surged by 2.3mb/d to 105.4mb/d in October and has risen by 5.3mb/d since August. Despite continued attacks on tankers, Gulf oil exports excluding Oman reached 18.4mb/d in October, although they remain around 26% below pre-war levels. The improving supply-demand balance should help to moderate the global energy price shock over the coming year, thereby easing inflationary pressures and reducing the need for central banks, including the Fed, to raise rates more aggressively.
PICK-UP IN LNG EXPORTS FROM AUSTRALIA
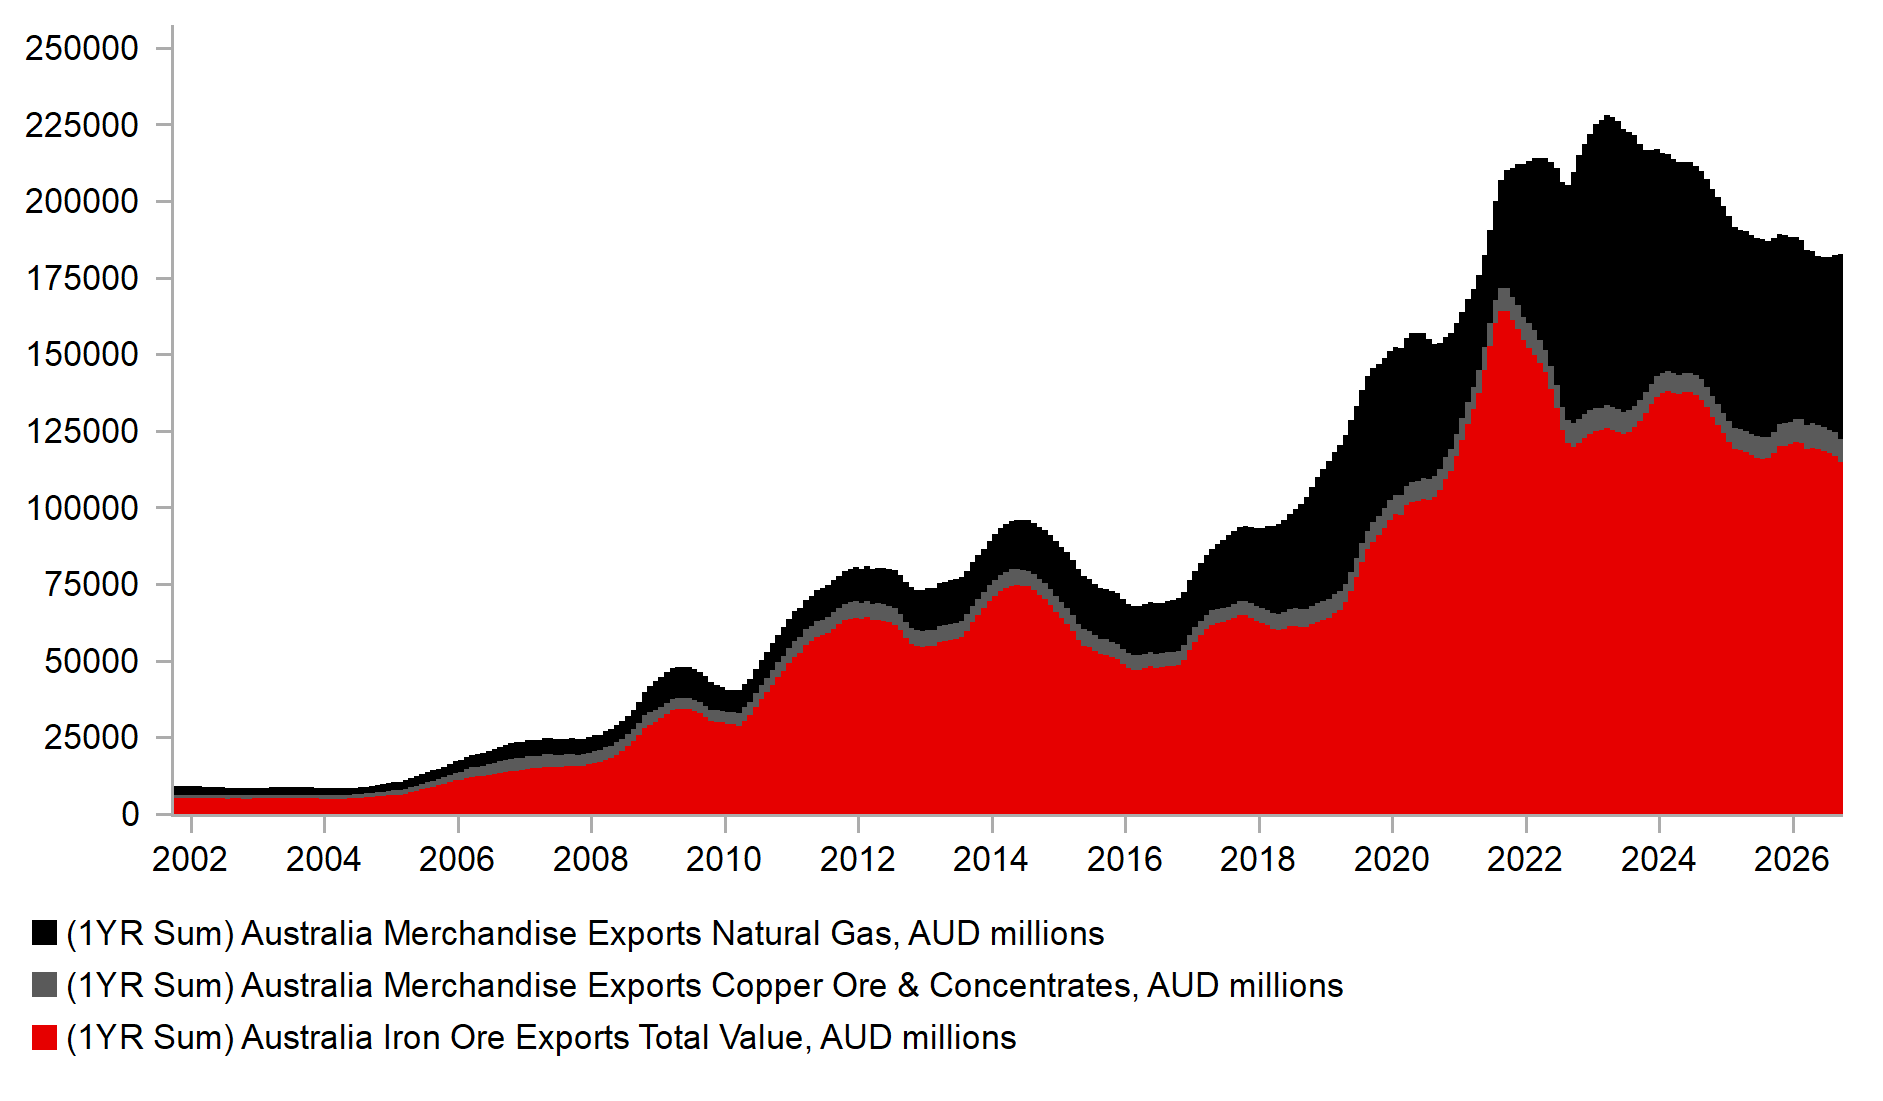
Source: Bloomberg, Macrobond & MUFG GMR
AUD & COPPER PRICE LINKS TO AI INVESTMENTS
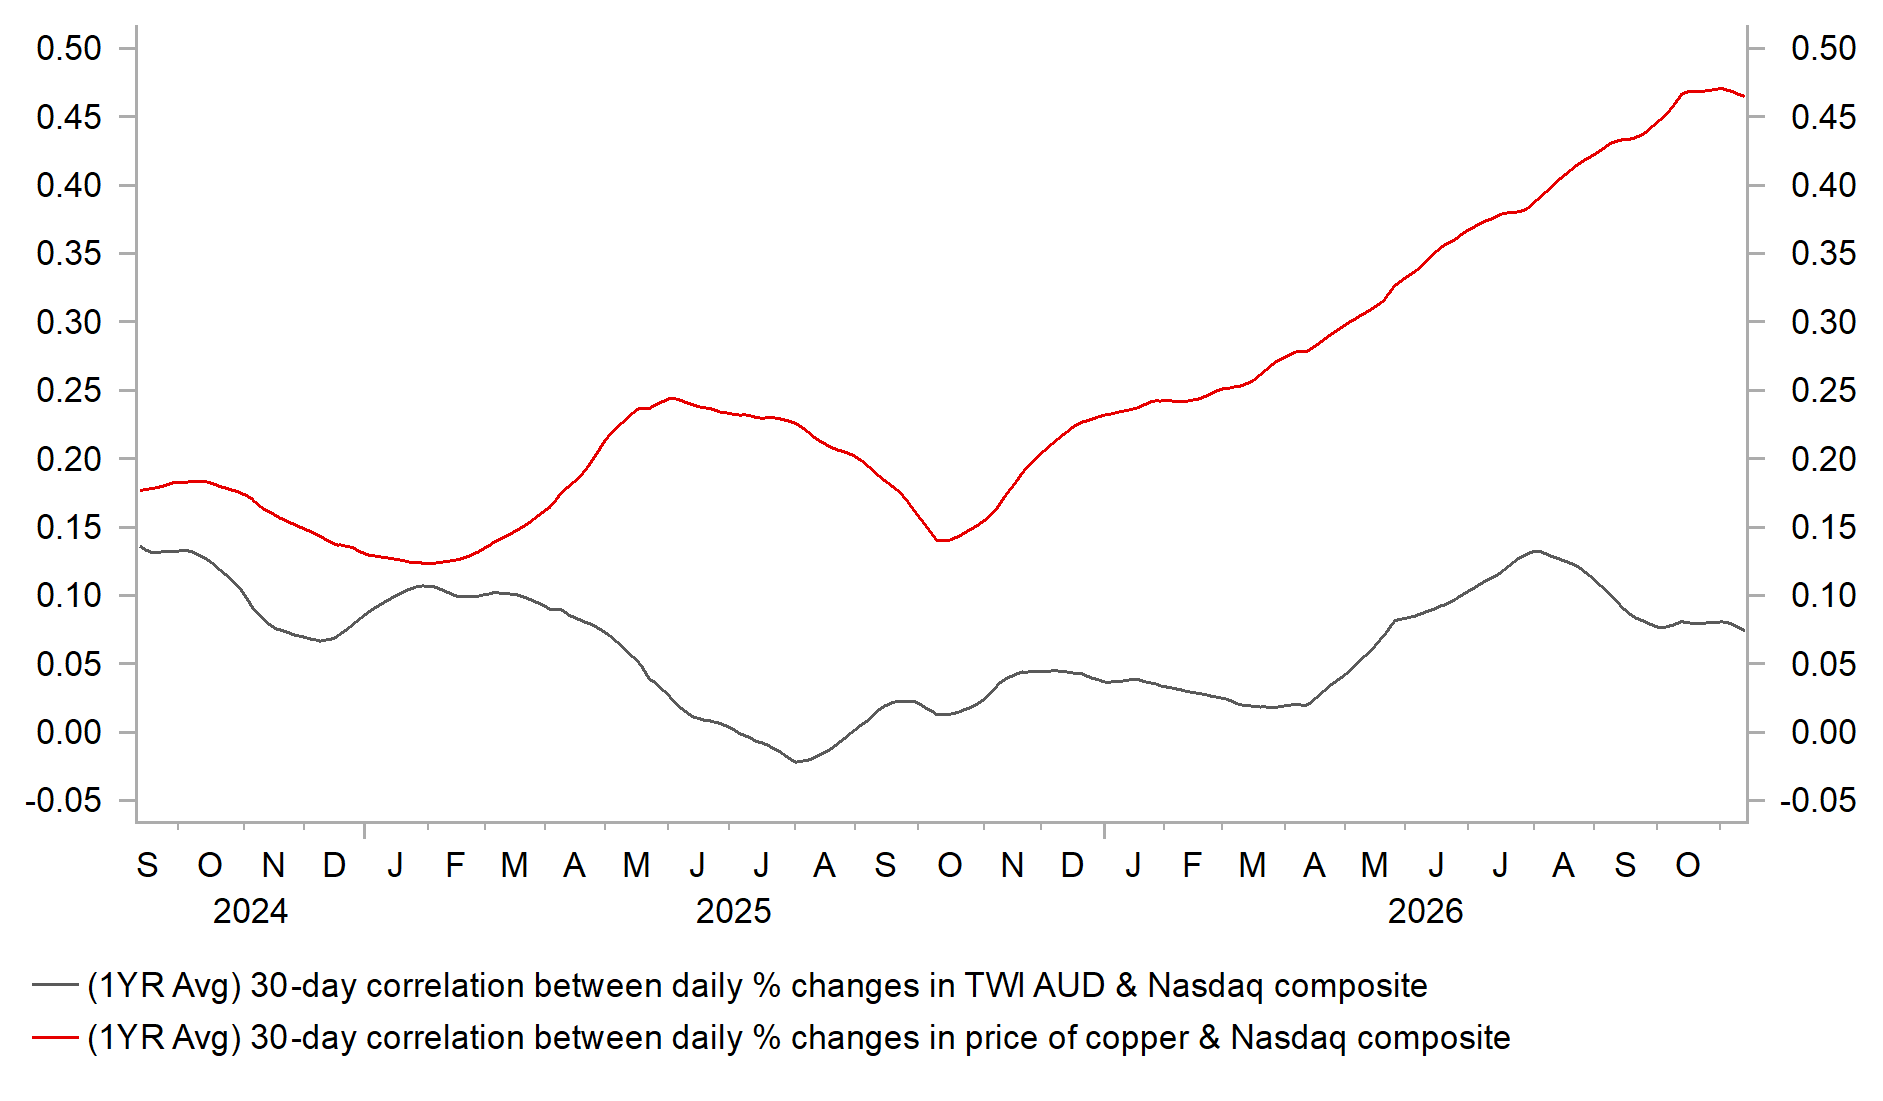
Source: Bloomberg, Macrobond & MUFG GMR
In the FX market, the NOK and AUD have borne the brunt of the sharp decline in energy prices this month, with both currencies falling by around 3.5% against the USD. Nevertheless, they remain the best-performing G10 currencies year-to-date. The NOK is still around 5.6% stronger against the USD than at the end of last year, while the AUD is around 1.8% stronger. A sustained decline in energy prices over the coming year could therefore encourage a further unwinding of their year-to-date gains. The AUD may also have received some support from the global AI build-out, primarily through stronger demand for Australia’s commodity and energy exports. However, the benefits appear mixed so far. The value of LNG exports surged by around 70% in the four months to the end of September, although this likely owes more to disruptions to LNG supply through the Middle East than to AI-related demand. In contrast, the value of iron ore and copper exports has declined by around 37% Y/Y and 16% Y/Y, respectively, over the past year.
Proxy measures of Australia’s terms of trade, which capture movements in export prices relative to import prices, have become more supportive of a stronger AUD this year, although the improvement is not yet evident in the official terms-of-trade data up to Q2. The improvement has been driven primarily by the sharp rise in the price of LNG exports to North Asia, which has increased by around 220% YTD. The price of copper has risen by a more modest 8% YTD, while the price of iron ore exports to China has declined by around 17% YTD. However, some of this support has started to reverse recently. Copper prices have fallen by around 6% this month alongside the correction lower for AI-related investments. At the same time, the correlation between copper prices and the Nasdaq Composite Index has strengthened notably this year. The recent loss of confidence in AI-related investments could therefore reinforce the reversal of the AUD’s gains from earlier this year, adding to downside risks for the currency heading into year-end.
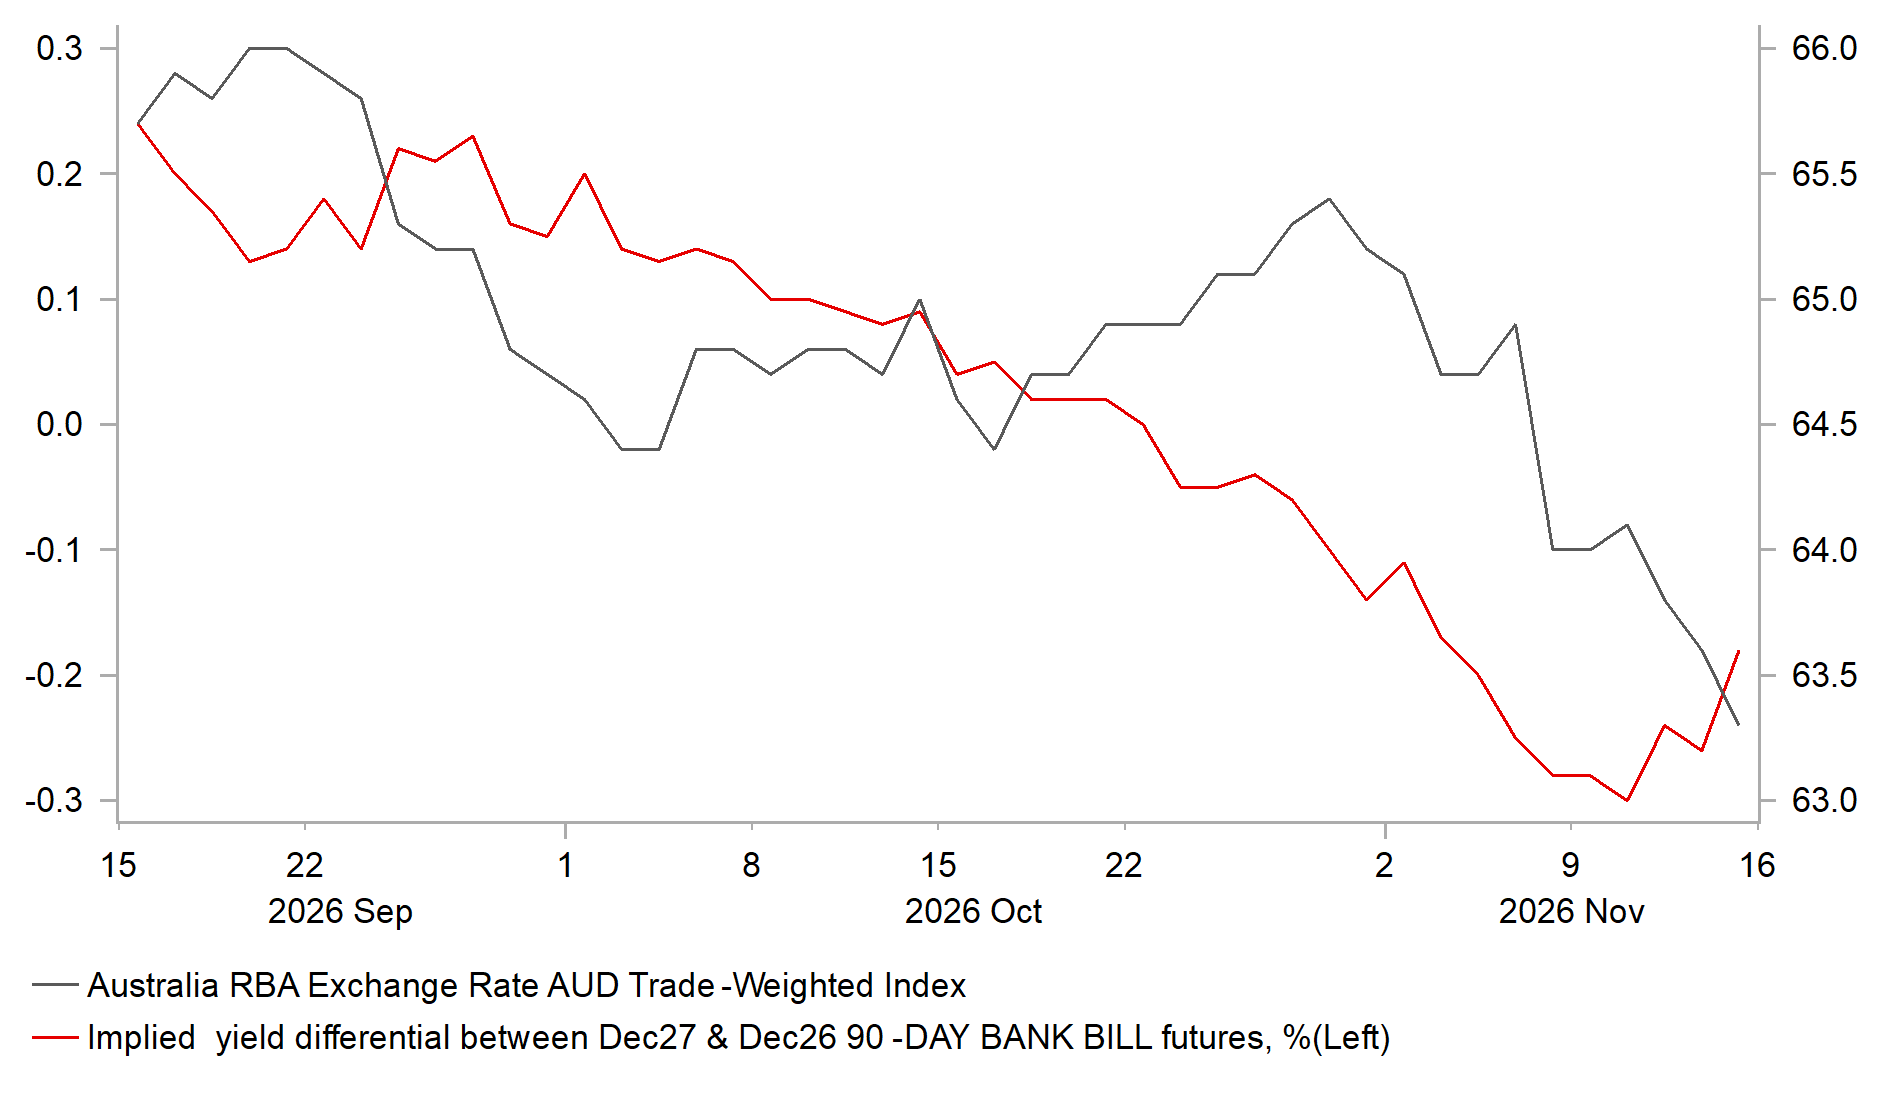
A final headwind for the AUD has come from the RBA’s latest policy communication, which signalled that it is considering pausing its tightening cycle after delivering a 25bps rate hike to 4.85% earlier this month. The RBA has been at the forefront of monetary tightening among G10 central banks this year, delivering five rate hikes totalling 125bps. However, market participants have become increasingly confident that the RBA’s tightening cycle is approaching an end at a time when most other G10 central banks remain inclined to raise rates further. This growing policy divergence has encouraged a narrowing of yield spreads, removing an important source of support for the AUD. Reflecting the shift in expectations, the Australian rates market is now assigning a higher probability to the RBA’s next policy move being a cut later next year.
TWI AUD VS. TERMS OF TRADE PROXIES
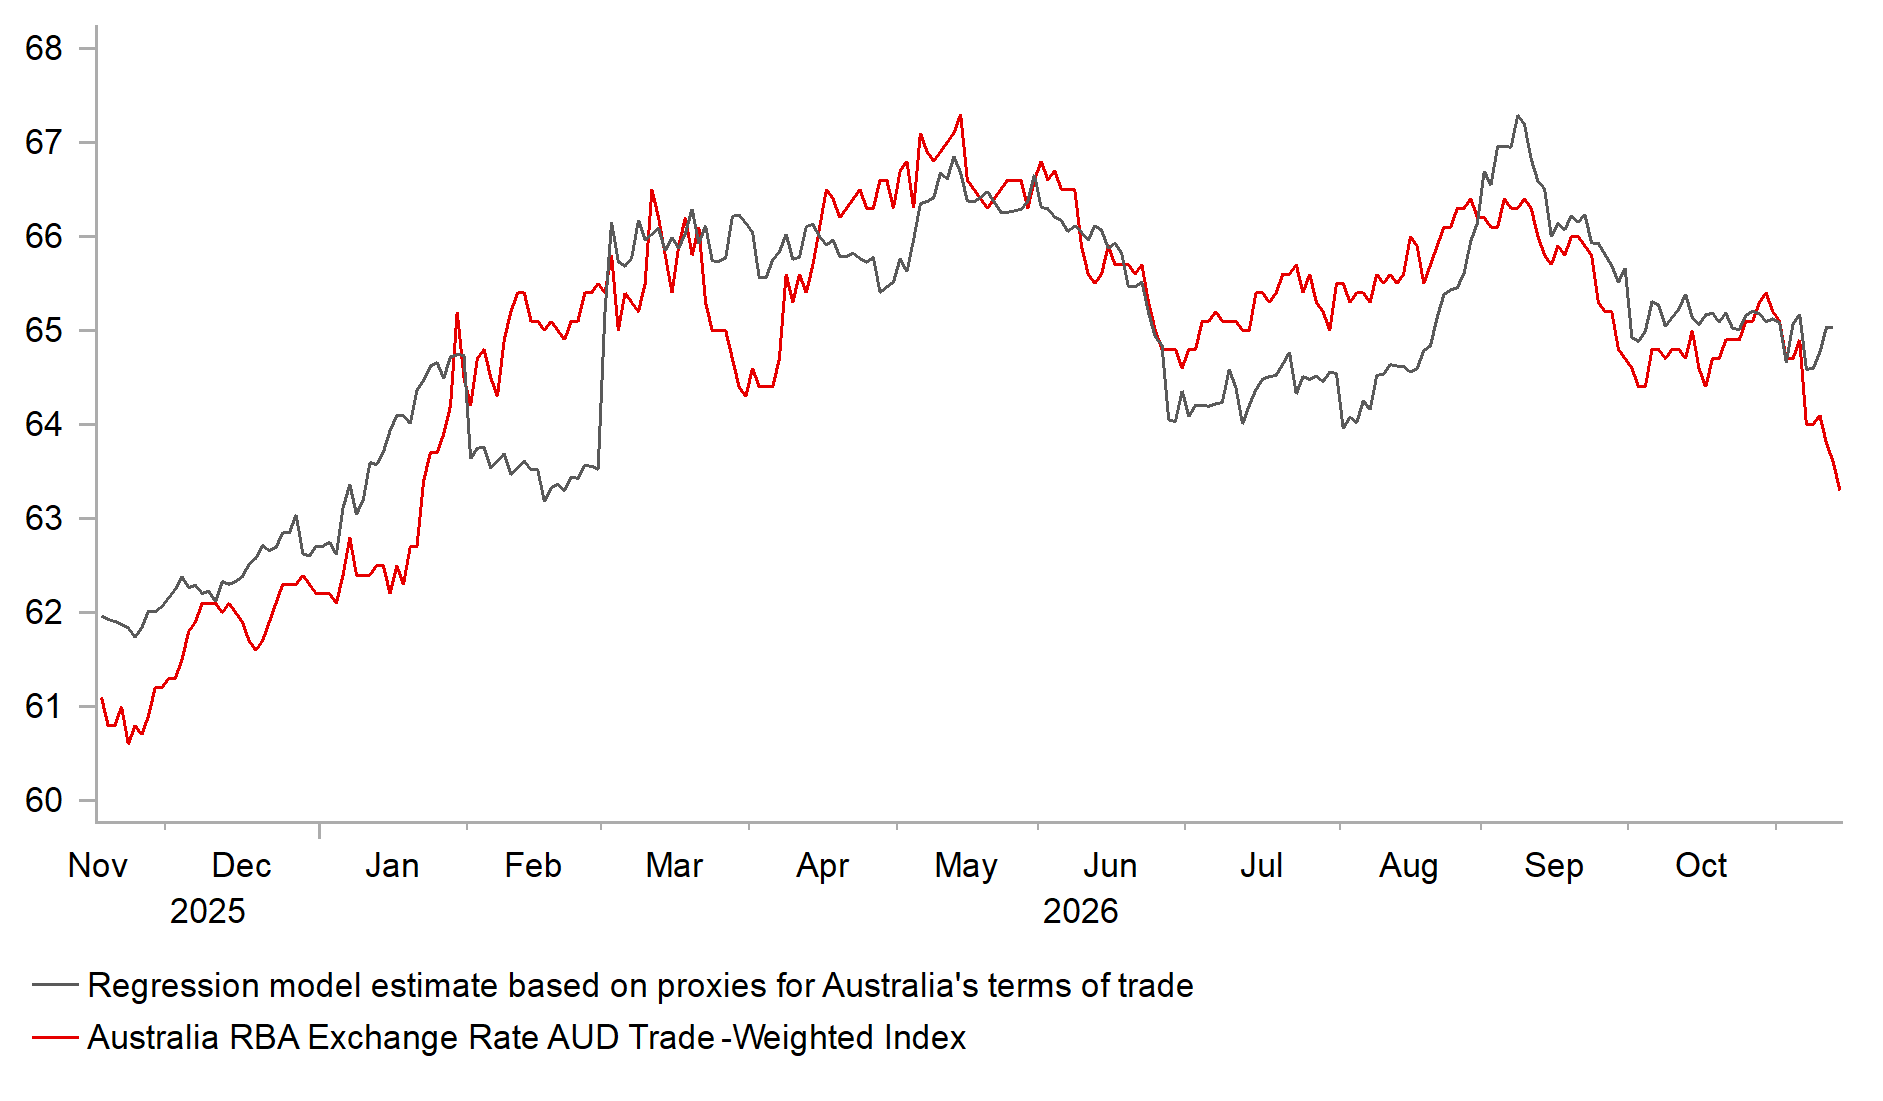
Source: Bloomberg, Macrobond & MUFG GMR
ANTICIPATING THE END OF RBA TIGHTENING CYCLE
Source: Bloomberg, Macrobond & MUFG GMR
Weekly Calendar
Ccy | Date | GMT | Indicator/Event | Period | Consensus | Previous | Mkt Moving |
JPY | 15/11/2026 | 23:50 | GDP Annualized SA QoQ | 3Q P | 0.2% | 1.4% | !!! |
CHF | 16/11/2026 | 08:00 | Sport Event adjusted GDP QoQ | 3Q P | -0.3% | 1.5% | !!! |
EUR | 16/11/2026 | 10:00 | Industrial Production SA MoM | Sep | 0.3% | -0.5% | !! |
CAD | 16/11/2026 | 13:30 | CPI YoY | Oct | 3.2% | 3.1% | !!! |
USD | 16/11/2026 | 14:05 | Fed's Williams Gives Opening Remarks | !!! | |||
USD | 16/11/2026 | 17:00 | Fed's Warsh Gives Opening Remarks | !!! | |||
AUD | 17/11/2026 | 00:30 | RBA Minutes of Nov. Policy Meeting | !! | |||
GBP | 17/11/2026 | 07:00 | Payrolled Employees Monthly Change | Oct | -- | 13k | !!! |
GBP | 17/11/2026 | 09:30 | New Measure Productivity Data for Q3 | !! | |||
USD | 17/11/2026 | 13:30 | Retail Sales Advance MoM | Oct | 0.1% | 0.8% | !!! |
USD | 17/11/2026 | 13:30 | Import Price Index MoM | Oct | -- | 1.1% | !! |
USD | 17/11/2026 | 14:15 | Industrial Production MoM | Oct | 0.1% | 0.7% | !! |
USD | 17/11/2026 | 14:30 | Fed's Hammack Speaks | !! | |||
EUR | 17/11/2026 | 18:30 | ECB's Lane Speaks | !!! | |||
JPY | 17/11/2026 | 23:50 | Trade Balance | Oct | -¥956.0b | -¥536.6b | !! |
GBP | 18/11/2026 | 07:00 | CPI YoY | Oct | 3.5% | 3.5% | !!! |
EUR | 18/11/2026 | 10:00 | CPI YoY | Oct F | 4.0% | 4.0% | !! |
USD | 18/11/2026 | 13:30 | Housing Starts | Oct | 1230k | 1221k | !! |
NZD | 18/11/2026 | 18:00 | RBNZ Governor Breman Speaks | !! | |||
USD | 18/11/2026 | 19:00 | FOMC Meeting Minutes | -- | -- | !!! | |
USD | 18/11/2026 | 19:30 | Fed's Williams Delivers Remarks | !! | |||
AUD | 19/11/2026 | 00:30 | Employment Change | Oct | 20.0k | -39.3k | !!! |
EUR | 19/11/2026 | 10:00 | Labour Costs YoY | 3Q P | -- | 3.1% | !! |
USD | 19/11/2026 | 13:30 | Initial Jobless Claims | -- | -- | !! | |
JPY | 19/11/2026 | 23:30 | Natl CPI YoY | Oct | 2.5% | 2.1% | !!! |
GBP | 20/11/2026 | 07:00 | Public Sector Net Borrowing | Oct | -- | 24.5b | !! |
GBP | 20/11/2026 | 07:00 | Retail Sales Inc Auto Fuel MoM | Oct | -- | -0.4% | !! |
EUR | 20/11/2026 | 10:00 | Negotiated Wages | 3Q | 2.6% | 2.4% | !! |
CAD | 20/11/2026 | 13:30 | Retail Sales MoM | Sep | -- | 1.2% | !! |
Source: Bloomberg & MUFG GMR
Key Events:
The outlook for Fed policy is likely to remain in focus in the week ahead after market participants moved to price in a faster pace of rate hikes following the third consecutive stronger-than-expected core CPI reading in October. There is a heavy schedule of Fed speakers, including Fed Chair Kevin Warsh, who is scheduled to deliver opening remarks at the Productivity and Jobs Task Force Conference hosted by the San Francisco Fed. Market participants will closely scrutinise upcoming comments from Fed officials to assess the likelihood of a larger 50bp hike in December and the possibility of back-to-back hikes in December and January. The minutes from the October FOMC meeting are also scheduled for release. We expect them to indicate that the Fed still intends to raise rates in December, although they could be viewed as somewhat dated following developments this week. At the October meeting, the Fed left rates unchanged, partly reflecting the recent tightening in US financial conditions.
The main UK economic data releases will be the latest CPI, labour market and retail sales reports. BoE officials have recently indicated that they expect to raise rates at least once more in the current tightening cycle and remain open to another hike as soon as the next MPC meeting in December. More persistent inflation, stronger growth and tentative signs of a pick-up in labour demand have encouraged a hawkish shift among MPC members. The upcoming reports are expected to remain consistent with further BoE tightening. The Q3 GDP report showed that the UK economy expanded strongly by 0.7%, driven by private consumption. The retail sales report will provide an indication of whether that growth momentum was sustained at the start of Q4.
The latest GDP and CPI reports from Japan will be released in the week ahead. The GDP report is expected to show that growth slowed in Q3, driven by weakness in private consumption and a drag from net trade. However, we do not expect softer growth to deter the BoJ from raising rates again in December. The October CPI report should reinforce the BoJ’s assessment that inflation risks remain tilted to the upside and that further policy tightening is warranted.