To read the full report, please download PDF.
Renewed dollar downside risks
FX View:
The US dollar is around 1.0% weaker this week underlining the negative momentum carry-through following the drop last Friday in response to the weaker than expected US jobs report. Yesterday at 00:01 EST, Trump’s latest round of tariff levels went live with limited fallout in the financial markets. Indeed, the S&P 500 yesterday closed just 1.4% below the latest record high on 31st July. This week we assess the sustainability of this investor optimism and indifference to the tariff policies of the US. We maintain that investors appear complacent and that lags for different reasons have meant the inflation impact has been limited. The lag may have further to run in assessing the impact of the latest tariffs but upside inflation risks will persist. Nonetheless, these lags may offer a window for Fed easing and the weak jobs data will likely see a Fed cut delivered in September. This week we also delve into statistical analysis on the FX impact following weak data and the scale of downward revisions we saw last week. The conclusions this week indicate short-term and medium-term downside risks for the dollar.
SWISS TARIFF SHOCK SEES CHF UNDERPERFORM THIS WEEK
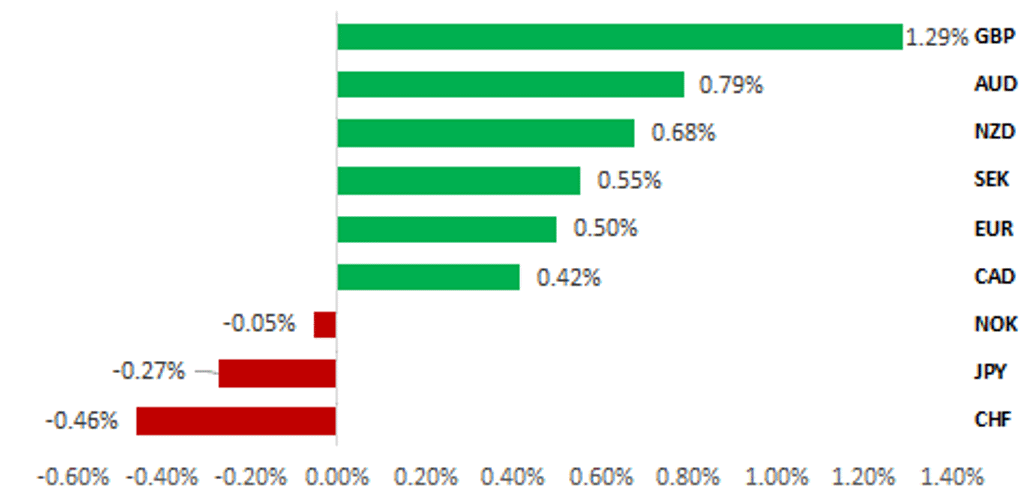
Source: Bloomberg, 12:30 BST, 8th August 2025 (Weekly % Change vs. USD)
Trade Ideas:
We are cutting our long EUR/GBP and long USD/JPY trade recommendations. The BoE meeting has shifted short-term risks while US dollar downside risks mean USD/JPY risks have shifted as well. We also introduce our first quant strategy, G10 cross-sectional momentum. This week the model suggests maintaining a long NOK/CHF position for 9 weeks.
FX Positioning:
The weekly IMM data has indicated worsening GBP sentiment suggesting short GBP positions built up prior to the BoE meeting. The same data also points to improved sentiment toward the Australian dollar.
Sentiment Analysis on the latest MPC Summary and minutes:
The MPC’s tone has shifted from neutral to dovish, with August showing a stronger easing bias. However, the cautious tone reflects stagflation risks. We therefore see little scope for continued GBP momentum in the weeks ahead.
FX Views
USD: Can market optimism be sustained – CPI next week a test
The US dollar has weakened further this week – from the close last Friday, the DXY index is down 1.0% with the negative momentum from last week’s jobs report persisting. The tariffs that had been announced throughout the month of July and finalised last week went live yesterday at 00:01 EST. The average effective tariff rate, now estimated to be at 18.3% (Budget Lab; Yale University) and the highest since 1934, has had limited impact on investor confidence. The S&P 500 closed yesterday just 1.4% below the record high set on 31st July. The 10-year breakeven rate in the US is currently trading only around 6bps higher than the average (2.30%) over the last two years. The 2s10s curve did steepen in response to the Liberation Day announcements in April but since then has stabilised in a 40bp-60bp range. Tariff revenues are surging and that could be helping to stabilise the long-end by easing fiscal risks. Can current implied optimism in the markets last?
What is clear is that investors are learning that reacting immediately to comments, speculation, and even policy announcements can prove counter-productive. The US equity market is ultimately driven by the level of corporate earnings and while we believe tariff risks have risen not fallen, the incoming corporate earnings news from US companies has been supportive for equities. According to Factset data as of last Friday, 66% of US companies have reported Q2 earnings results and 82% of those have reported EPS above estimates, higher than the 5-year average of 78%. If 82% is the final figure it would be the highest since Q3 2021. Results this week were a bit more mixed but negative EPS guidance for the quarter ahead was below average. Separate data (IOT Analytics) reported that 75% of earnings calls cited tariffs.
The focus on tariffs on earnings calls is understandable and there remains a high level of uncertainty over the scale and timing of the impact. The first relates to the huge surge in imports and hence inventories in Q1 that front-ran the tariffs and this additional supply of tariff-free goods are being worked off. Excluding the covid volatile period, the inventory build in Q1 was the second largest on record in data back to 1999. The Q/Q increase in imports was the largest outside of covid. Q2 GDP data shows those inventories fell and that should mean greater exposure to tariff rates going forward. The guidance from the US government on tariffs also indicates that goods shipped and in transit before 7th August that arrives in the US prior to 7th October will not be charged the new tariffs. UStradenumbers.com reveals that 44% of US imported goods are seaborne highlighting a further lag on goods. Maersk shipping data reveals that it takes 15 to 45 days for shipping containers to travel from Asia/Europe to the US. The full impact of the latest tariffs may not be evident until the October CPI data in November.
US 10-YR BREAKEVEN REMARKABLY STABLE
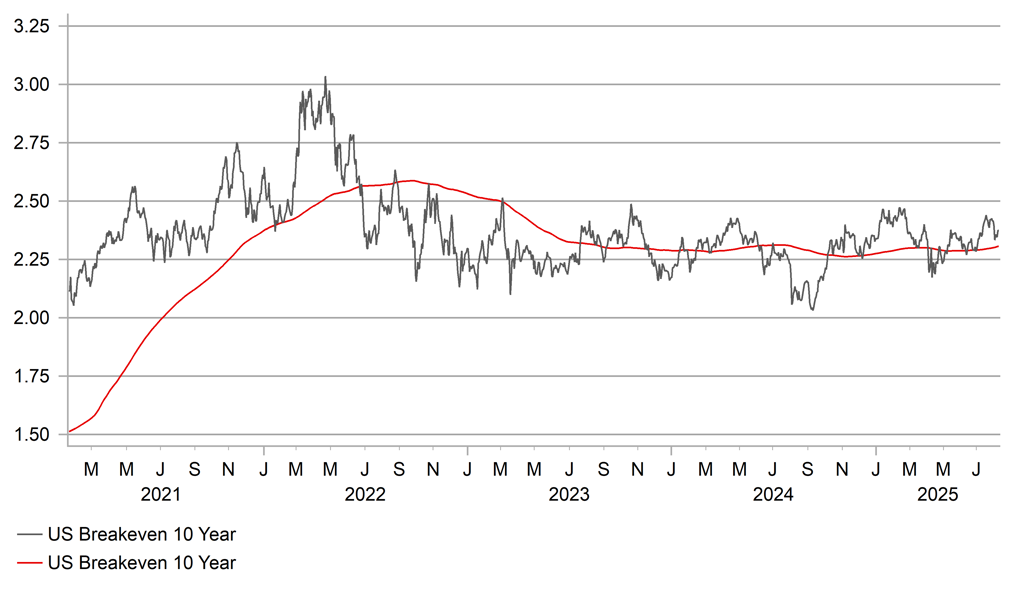
Source: Bloomberg & Macrobond
CPI IMPORT-HEAVY COMPONENTS JUMPED IN JUNE
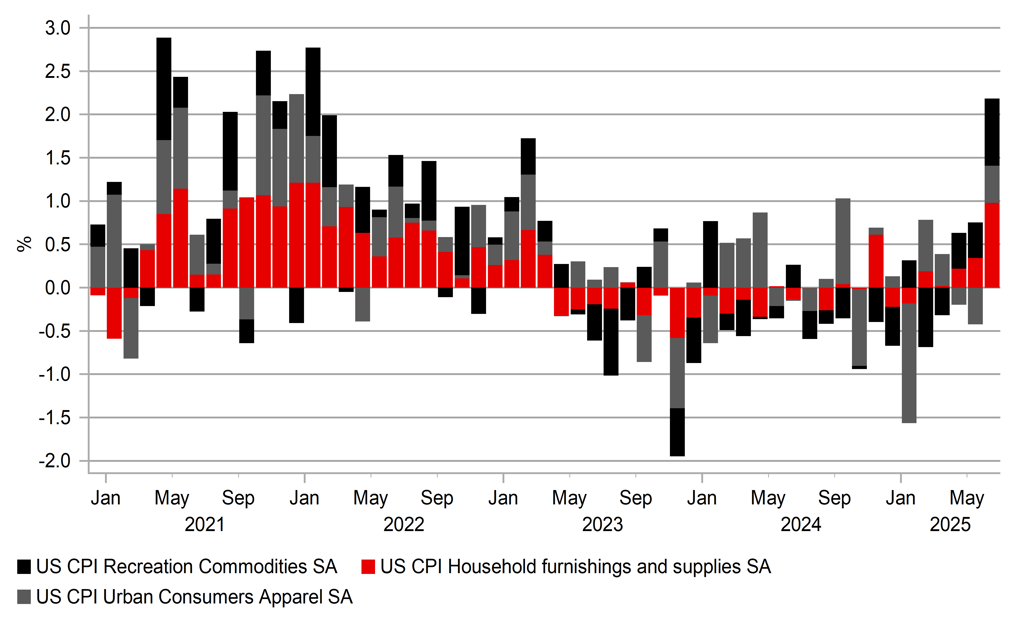
Source: Bloomberg, Macrobond & MUFG GMR
While the full impact from the latest tariffs may take time to feed through to CPI data, the CPI data next week for July will still be very important. As can be seen in the chart above, the June CPI did reveal evidence that the tariff rates already live are starting to have a bigger impact. Apparel, household furnishings, and recreation goods are three of the most import-intensive categories in CPI and when the June MoM increases are combined, the increase was the largest since January 2022 during the global inflation shock post-covid. The full scale of tariff increases are unlikely to pass to the end-consumer and Japan’s export price index for autos into North America showed a sharp drop (-20%) that points to suppliers’ margin being squeezed. But this will be more evident in goods that consumers can easily substitute and hence will differ widely. For sure, final CPI will likely show the pass-through and the June data was likely the start.
The very weak payrolls data last Friday was certainly a gamechanger in increasing notably the prospect of near-term rate cuts. The decision from Trump to nominate Stephen Miran to the Board of Governors temporarily will add to the Governors calling for rate cuts. Assuming his confirmation is quick he should be in place for the September FOMC meeting and the three following meeting through to the meeting on 28th Jan 2026. The market is nearly priced for three 25bp cuts by then which seem reasonable assuming there is no nasty shock in CPI data. Given the emerging evidence in June of a tariff impact that is still a clear risk but at this point we assume the weakness in the jobs data and the building rhetoric amongst Fed officials for a cut means a cut will be delivered in September and additional cuts beyond.
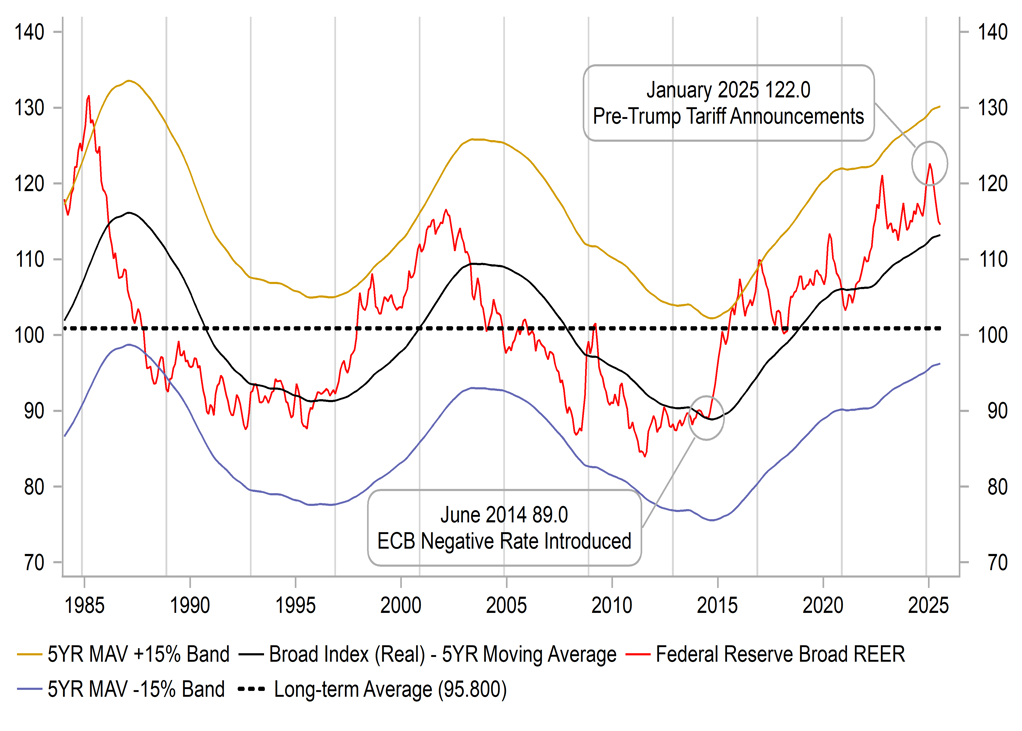
The US dollar has basically stabilised since the post-Liberation Day low on 21st April. From that low, the dollar initially rebounded 4% and then weakened to a new low, 1.7% below the low in April and is today trading around the level of that low in April (98.000). The consolidation of the dollar since the April low reflected three factors – 1) Trump reversing course and suspending the Liberation Day tariffs; 2) Trump reassuring markets he would not fire Fed Chair Powell; and 3) reasonably resilient payrolls reports in May, June and July. We believe these three factors are no longer as compelling. The new tariffs may be lower than Liberation Day levels but are still high and could yet get worse with China back in focus next week and Trump threatening tariffs related to Russia oil purchases. Pharma and semi-conductor chip tariffs are coming too. Secondly, while Powell is unlikely to be fired Trump is about to influence the Board of Governors sooner than expected while thirdly of course the jobs report last week has altered perceptions about the jobs market. With rate cuts likely, in circumstances of inflation risks that will persist possibly through the remainder of the year, the next leg for the dollar is likely to be another phase of depreciation rather than recovery.
OIS MARKET PRICING HIGHLIGHTS THE FED WITH THE MOST EASING PRICED BY MID-2026
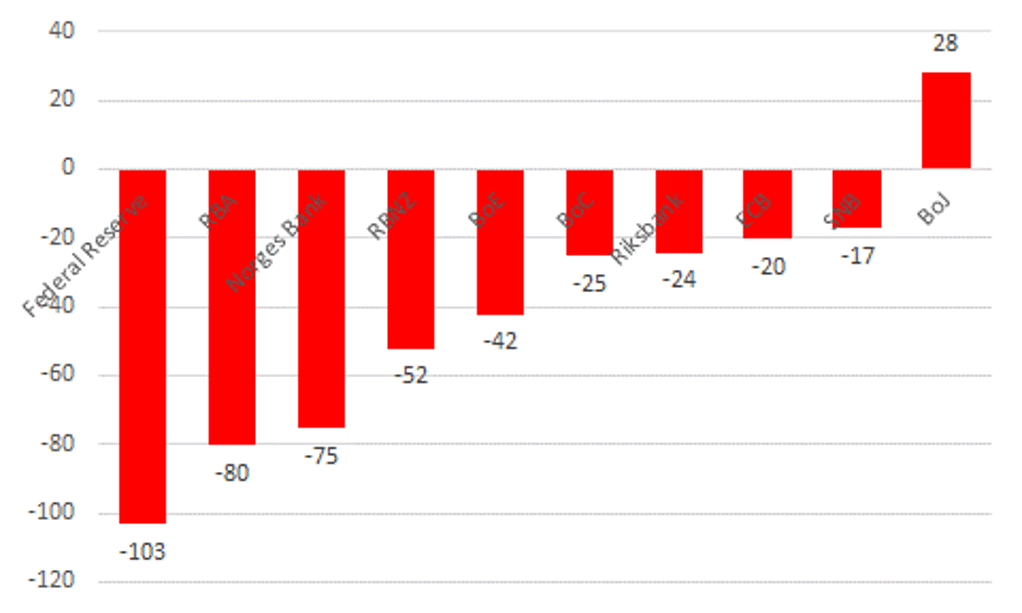
Source: Bloomberg & MUFG GMR; as of 8th August 2025
DESPITE USD CORRECTION WEAKER IN H1 REER REMAINS 15% STRONGER THAN LONG-TERM AVG
Source: Bloomberg, Macrobond & MUFG GMR
USD: When Rare NFP Dynamics Create a Perfect Storm for FX
In the world of FX, price action is often shaped by a confluence of economic factors, what some might call a “perfect storm.” As currency analysts, we routinely monitor a broad spectrum of calendar events, from headline economic data releases to multi-week government bond auctions. Market participants frequently form expectations based on experience and intuition, but how statistically robust are these expectations? Can they withstand scrutiny under the lens of p-values and t-statistics? More importantly, can we quantify them to generate actionable signals that challenge the sustaining “tough market” narrative?
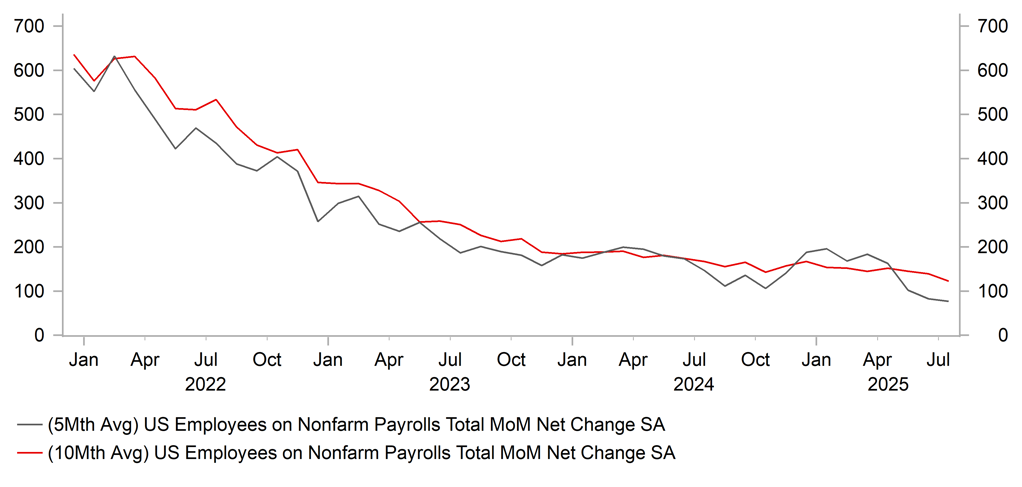
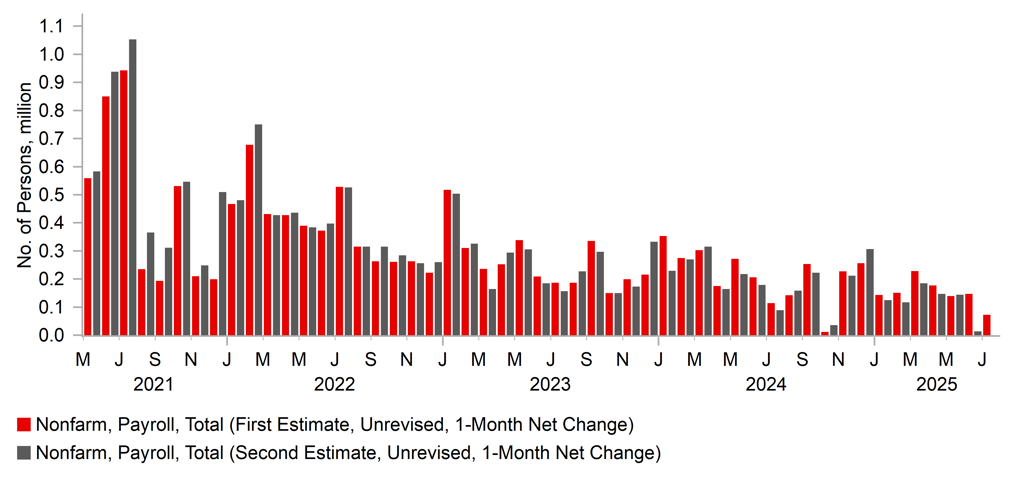
Last week’s NFP report presented a rare and statistically significant culmination of events. Not only did the July NFP print surprise to the downside (73k vs 105k expectation), coming in below the median Bloomberg survey forecast, but both the June and May figure was significantly revised lower, a combined impact of -258k jobs. This has only occurred 20 out of 304 monthly releases since January 2000. In this report, we examine the FX implications of this rare NFP dynamic, focusing on short-term FX price action in the subsequent periods. Our analysis leverages historical FX returns and statistical testing to assess the strength of the signal, assessing whether it can influence FX positioning in the current macro environment
We retrieve FX daily close data and NFP data through the Bloomberg API, incorporating actual, prior, and revised figures, as well as forecast statistics such as the median, average, high, and low estimates. Using this dataset, we define two key event types; a significant downward revision, where the prior NFP figure is revised lower by more than 50%, and a downward surprise, where the actual NFP print falls below the median forecast. Additionally, we compute daily FX return features, capturing the performance of over a 21-day trading period.

To evaluate the statistical significance of these patterns, we apply p-values and t-statistics. A low p-value (typically < 0.05) suggests the observed effect is unlikely due to chance, while a high absolute t-statistic (generally > 2 or < -2) indicates a strong relationship between the event/combination of events and FX returns.
NFP MONTHLY JOB CHANGES
Source: Bloomberg, Macrobond & MUFG GMR
FP 1ST ESTIMATE VERSUS 1ST REVISION
Source: Bloomberg, Macrobond & MUFG GMR
At time of writing, the latest NFP report was released on August 1st, 2025. Today marks the fifth trading day since its release. In this analysis, we examine whether FX markets exhibit a delayed reaction to the report, focusing on the statistical significance of price movements that occur after the initial release and whether there is a continued directional trend in the subsequent trading days.
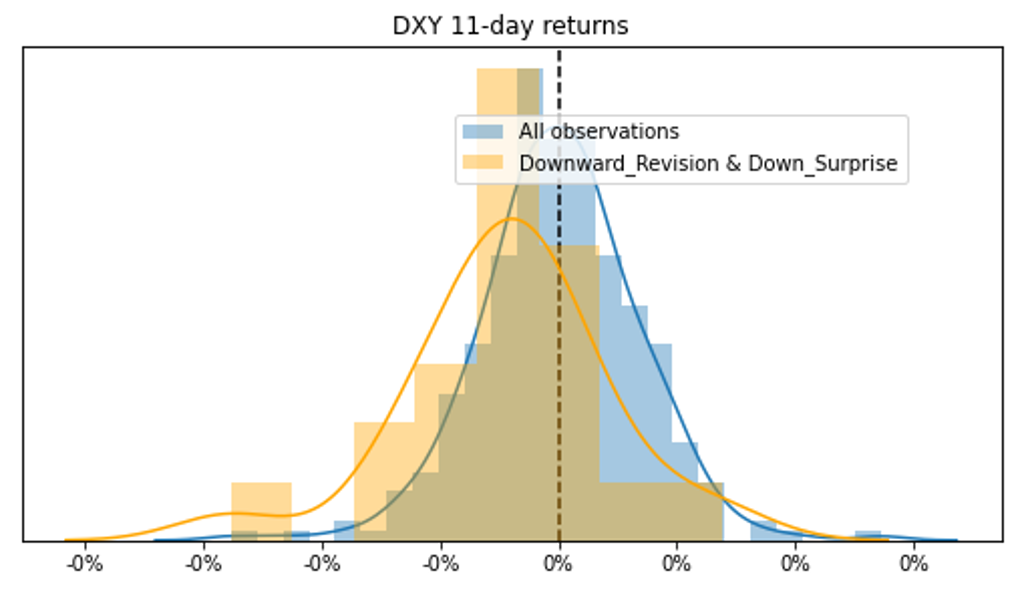
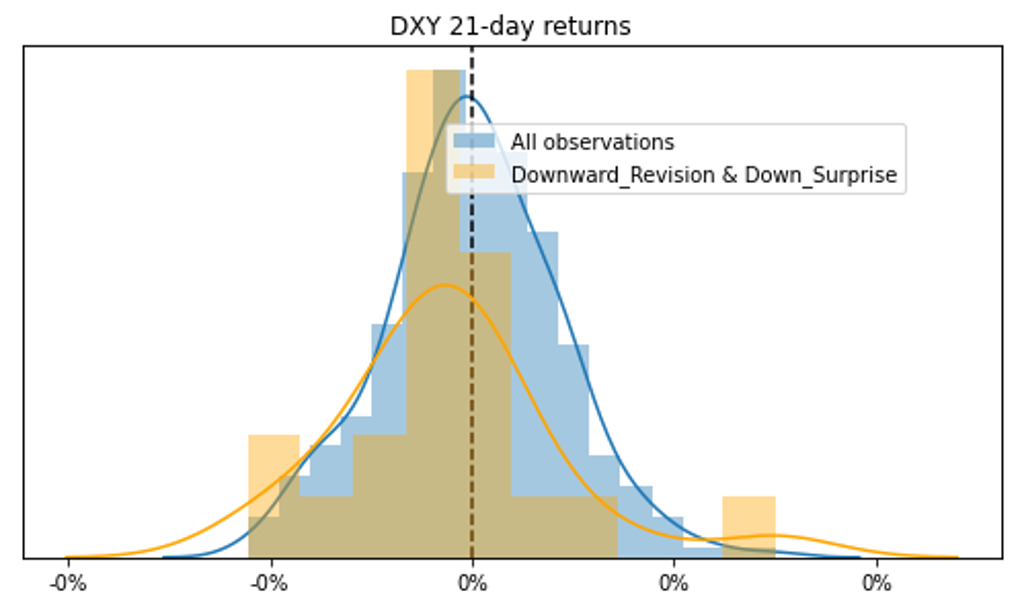
Based on historical data, DXY continues to weaken daily following NFP events with both a downward revision and downside surprise. The weakening is statistically significant across multiple days, especially between 6-12 trading days. The directional bias remains consistent across the entire 21-trading day period. Even when statistical significance fades, the economic signal remains directionally aligned.
This is visually evident when examining the distribution of DXY returns over the 11-day and 21-day horizons following the flagged NFP release. The data reveals a downside bias, suggesting persistent USD weakness over the period.
Source: Bloomberg, Macrobond & MUFG GMR
Source: Bloomberg, Macrobond & MUFG GMR

Source: Bloomberg, Macrobond & MUFG GMR
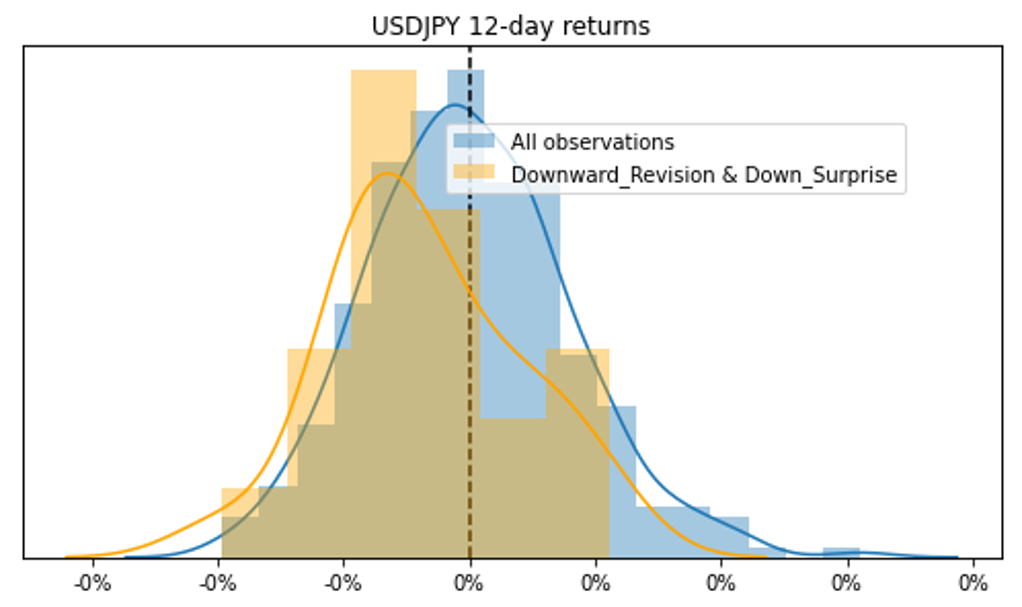
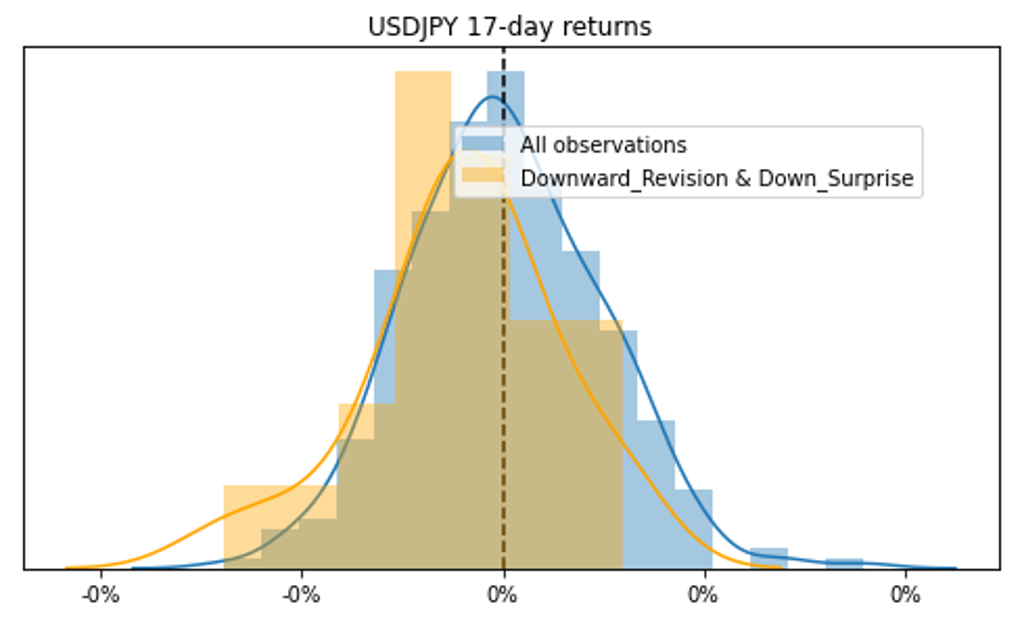
Based on historical data, USD/JPY continues to weaken daily following NFP events with both a downward revision and downside surprise. P-values notably hover around the significance threshold between 7 and 18 days, suggesting delayed and persistent weakening of USD/JPY.
This is visually evident when examining the distribution of USDJPY returns over the 12-day and 17-day horizons following the NFP release. The data reveals a downside bias, suggesting persistent USDJPY weakness over the period. This bias remains evident up to the assessed 21-day mark.
Source: Bloomberg, Macrobond & MUFG GMR
Source: Bloomberg, Macrobond & MUFG GMR

Source: Bloomberg, Macrobond & MUFG GMR
Weekly Calendar
|
Ccy |
Date |
BST |
Indicator/Event |
Period |
Consensus |
Previous |
Mkt Moving |
|
AUD |
08/12/2025 |
05:30 |
RBA Policy Rate Decision |
3.60% |
3.85% |
!!!! |
|
|
GBP |
08/12/2025 |
07:00 |
ILO Unemployment Rate 3Mths |
Jun |
-- |
4.70% |
!!! |
|
GBP |
08/12/2025 |
07:00 |
Employment Change 3M/3M |
Jun |
-- |
134k |
!!! |
|
GBP |
08/12/2025 |
07:00 |
Payrolled Employees Monthly Change |
Jul |
-- |
-41k |
!!!! |
|
GBP |
08/12/2025 |
07:00 |
Average Weekly Earnings 3M/YoY |
Jun |
-- |
5.00% |
!!!! |
|
EUR |
08/12/2025 |
10:00 |
ZEW Survey Current Situation |
Aug |
-- |
-59.5 |
!! |
|
USD |
08/12/2025 |
13:30 |
CPI MoM |
Jul |
0.20% |
0.30% |
!!!! |
|
USD |
08/12/2025 |
13:30 |
CPI Ex Food and Energy MoM |
Jul |
0.30% |
0.20% |
!!!!! |
|
USD |
08/12/2025 |
13:30 |
CPI YoY |
Jul |
2.80% |
2.70% |
!!!! |
|
USD |
08/12/2025 |
13:30 |
CPI Ex Food and Energy YoY |
Jul |
3.00% |
2.90% |
!!!! |
|
USD |
08/12/2025 |
15:00 |
Fed's Barkin speaks |
||||
|
EUR |
08/13/2025 |
07:00 |
CPI EU Harmonized MoM |
Jul F |
-- |
0.40% |
!! |
|
EUR |
08/13/2025 |
07:00 |
CPI EU Harmonized YoY |
Jul F |
-- |
1.80% |
!! |
|
USD |
08/13/2025 |
18:00 |
Fed's Goolsbee speaks |
||||
|
USD |
08/13/2025 |
18:30 |
Fed's Bostic speaks |
||||
|
GBP |
08/14/2025 |
00:01 |
RICS House Price Balance |
Jul |
-- |
-7.00% |
! |
|
GBP |
08/14/2025 |
07:00 |
GDP QoQ |
2Q P |
-- |
0.70% |
!!! |
|
GBP |
08/14/2025 |
07:00 |
Monthly GDP (MoM) |
Jun |
-- |
-0.10% |
!!! |
|
EUR |
08/14/2025 |
10:00 |
GDP SA QoQ |
2Q S |
-- |
0.10% |
!! |
|
USD |
08/14/2025 |
13:30 |
PPI Final Demand MoM |
Jul |
0.20% |
0.00% |
!!!! |
|
USD |
08/14/2025 |
13:30 |
PPI Ex Food and Energy MoM |
Jul |
0.20% |
0.00% |
!!!! |
|
USD |
08/14/2025 |
13:30 |
Initial Jobless Claims |
9-Aug |
-- |
-- |
!!! |
|
JPY |
08/15/2025 |
00:50 |
GDP Annualized SA QoQ |
2Q P |
0.20% |
-0.20% |
!!! |
|
USD |
08/15/2025 |
13:30 |
Retail Sales Ex Auto and Gas |
Jul |
0.30% |
0.60% |
!!!! |
|
USD |
08/15/2025 |
13:30 |
Retail Sales Control Group |
Jul |
0.50% |
0.50% |
!!!! |
|
USD |
08/15/2025 |
13:30 |
Import Price Index MoM |
Jul |
0.00% |
0.10% |
! |
|
USD |
08/15/2025 |
14:15 |
Industrial Production MoM |
Jul |
-0.10% |
0.30% |
!! |
|
USD |
08/15/2025 |
14:15 |
Manufacturing (SIC) Production |
Jul |
-- |
0.10% |
!! |
|
USD |
08/15/2025 |
15:00 |
U. of Mich. Sentiment |
Aug P |
62.5 |
61.7 |
!!! |
|
USD |
08/15/2025 |
15:00 |
U. of Mich. 1 Yr Inflation |
Aug P |
-- |
4.50% |
!!!! |
|
USD |
08/15/2025 |
15:00 |
U. of Mich. 5-10 Yr Inflation |
Aug P |
-- |
3.40% |
!!!! |
|
USD |
08/15/2025 |
21:00 |
Net Long-term TIC Flows |
Jun |
-- |
$259.4b |
! |
|
USD |
08/15/2025 |
21:00 |
Total Net TIC Flows |
Jun |
-- |
$311.1b |
! |
Source: Bloomberg & MUFG GMR
Key Events:
- Firstly, beyond the data schedule above, next Tuesday is the deadline for the current truce in the US-China trade conflict and how that unfolds will be crucial for investor sentiment. Hints of a 90-day extension have helped investors absorb the tariff announcements elsewhere but Trump on Wednesday implied that China could be hit with tariffs due to its purchases of Russian oil. Geopolitics will likely also be in focus given the reports that Presidents Putin and Trump could meet in the “next few days”. Better prospects of peace in Ukraine would help sentiment and likely help lift the euro.
- The week starts quite but the key central bank meeting within G10 will take place on Tuesday with the RBA fully expected to lower its policy rate by 25bps to 3.60%. The trimmed mean and weighted median CPI YoY rates fell to 2.7% in Q2, close to the mid-point of the RBA’s 2.0%-3.0% target range and there is no justification for further caution. At least one further cut this year is likely.
- There will also be some key economic releases from the UK and the US. The UK employment data will be key for shaping market expectations on the speed of further rate cuts from the BoE. With the BoE seeing further slack opening up further signs of weakness will reinforce market expectations of additional rate cuts going forward. Another rate cut is expected in November but any signs of unexpected weakness could see more cuts priced. The US CPI and PPI data will also be released. The CPI data is hugely important given the tariff risks to inflation. The June CPI data did reveal a pick-up in goods inflation and if those signs are more apparent it will complicate the Fed’s decision on whether to cut in September following the weak jobs report last week.
