

The Yen Turning Point?
The current yen appreciation episode differs from recent corrections because the common drivers of structural yen weakness shifted.
Our quant analysis framework flags traditional carry dynamics have deteriorated meaningfully. The US-Japan yield differential has narrowed significantly from peak carry-trade levels, while JGBs have risen to their highest levels in decades.
The combination of weaker carry support, softer capital outflows, ongoing BoJ tightening, and an emerging political dimension suggests the current appreciation phase may prove more persistent than recent historical precedents.
Overview
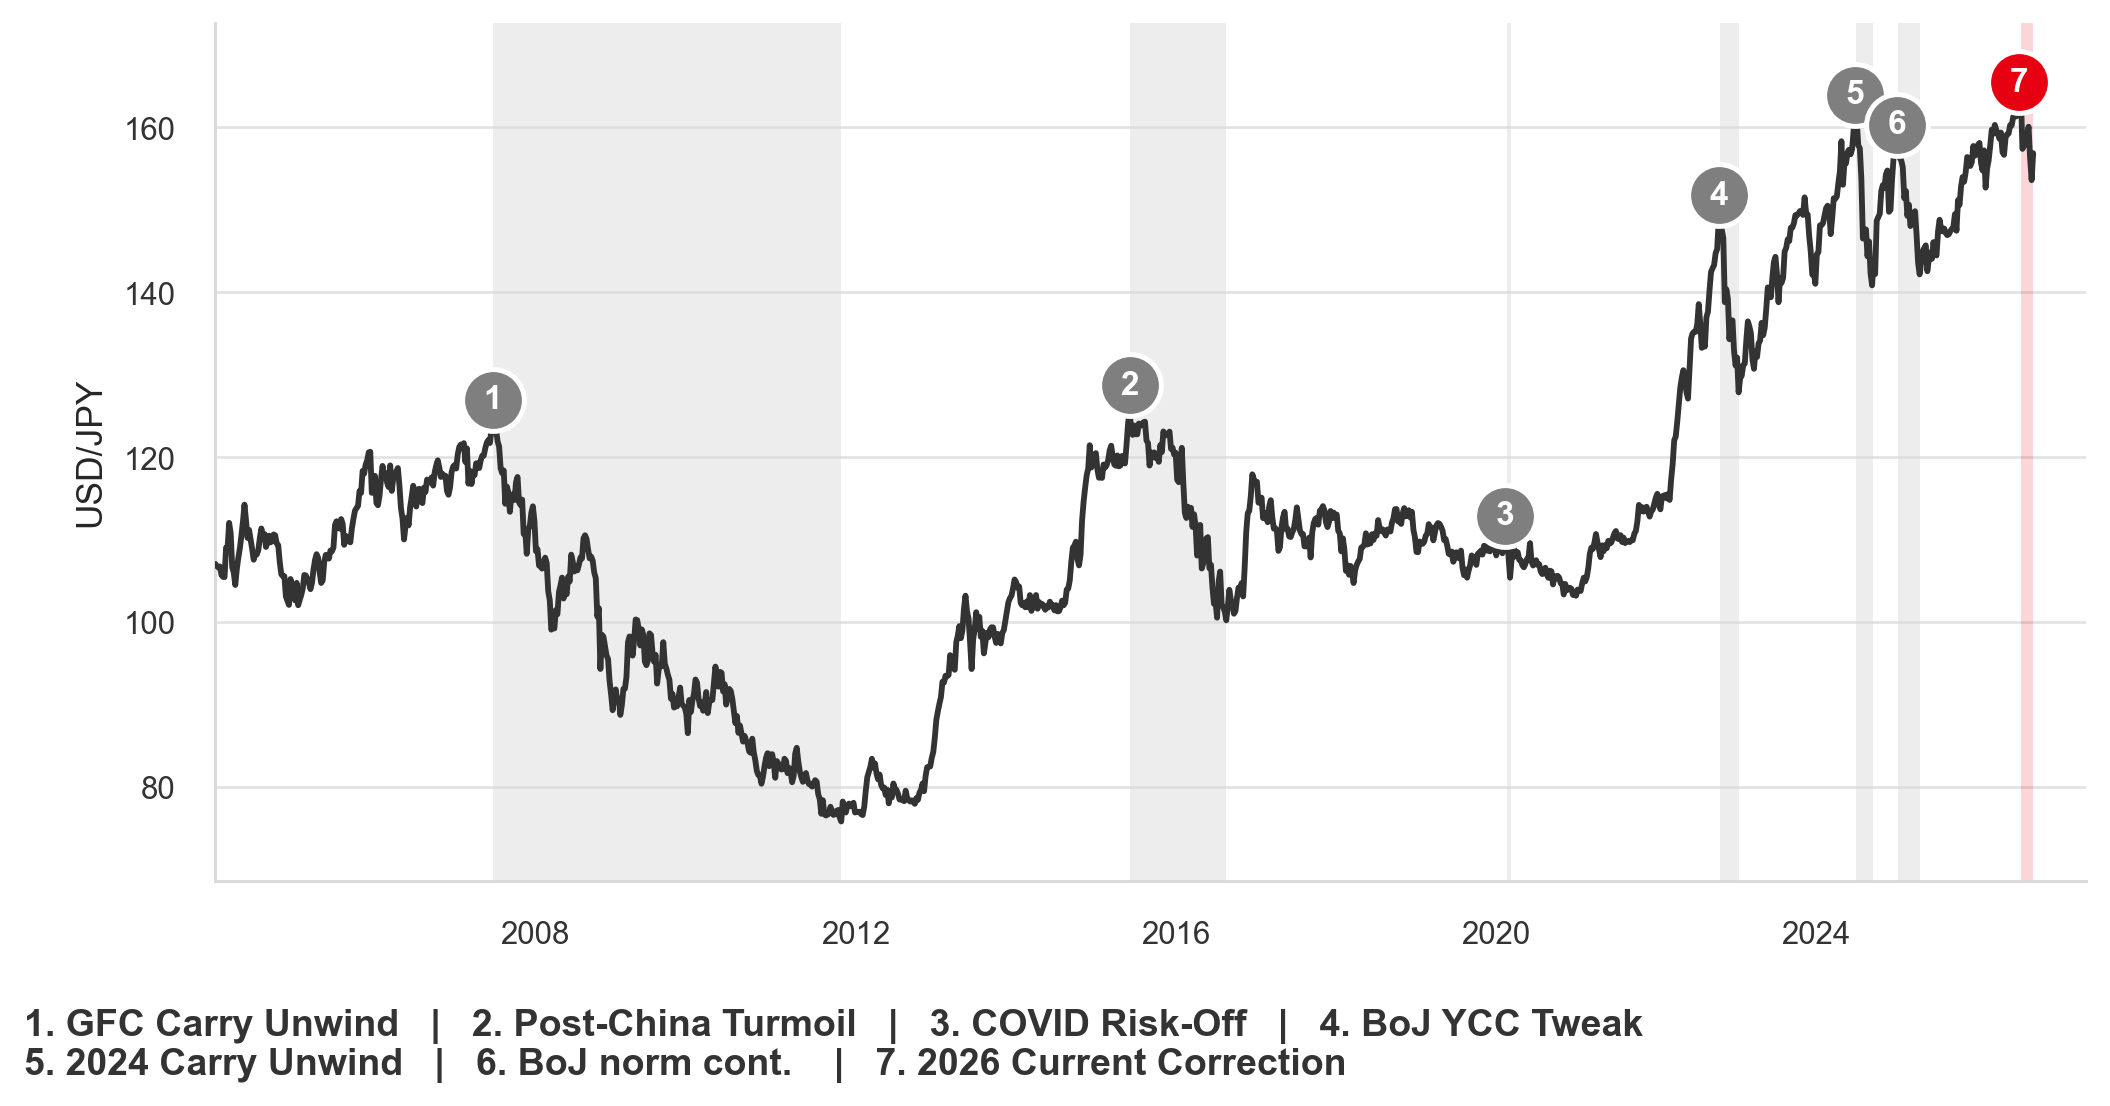
The yen has experienced seven major macro appreciation episodes since 2004, yet history demonstrates that not all JPY rallies are created equal. Some prove temporary, driven by positioning or temporary changes in risk sentiment while others evolve into regime defining appreciation cycles. The key question facing market participants today is whether the ongoing 2026 correction is likely to be short-lived or longer lasting representing the early stages of a broader structural realignment.
To address this question, we construct a framework of macroeconomic, policy and market-based indicators and evaluate the conditions present immediately before each major USD/JPY peak. The objective is to understand what conditions existed before the turning point occurred and whether those conditions offer clues about the persistence of subsequent JPY appreciation.
The completed appreciation episodes divide into two groups. The first comprises of short-lived corrections, including COVID and the BoJ's YCC adjustment. Each generated a sharp appreciation in the yen, but none altered the broader USD/JPY trend. Once volatility subsided, positioning normalised, market participants resumed seeking carry trades thereby lifting USD/JPY back higher. The second comprises longer-lasting appreciation cycles. The GFC episode persisted for more than four years, while the post-China market turmoil episode extended for over fourteen months. These episodes reflected fundamental shifts in the macroeconomic backdrop and required a broader change in monetary policy and then capital-flow dynamics before USD/JPY could establish a sustained recovery.
USD/JPY SINCE 2004: MAJOR JPY APPRECIATION EPISODES
Source: Bloomberg, Macrobond & MUFG GMR
Episode | Peak Date | Trough Date | JPY Change (%) | Duration (Months) |
GFC Carry Unwind | Jun-2007 | Oct-2011 | 38.8 | 52.3 (Long) |
Post China market turmoil | Jun-2015 | Aug-2016 | 20.5 | 14.5 (Long) |
COVID Risk-Off | Feb-2020 | Mar-2020 | 8.7 | 0.6 (Short) |
BoJ YCC Tweak | Oct-2022 | Jan-2023 | 14.8 | 2.8 (Short) |
2024 Carry Unwind | Jul-2024 | Sep-2024 | 13.0 | 2.5 (Short) |
BoJ norm cont. | Jan-2025 | Apr-2025 | 11.0 | 3.4 (Short) |
2026 Current Correction* | Jul-2026 | Present | 3.4 | 1.6 (Un-classified) |
*Ongoing episode.
Methodology
To identify the conditions associated with major USD/JPY turning points, we analyse a series of macroeconomic, policy and market-based indicators immediately preceding each significant USD/JPY peak since 2004.
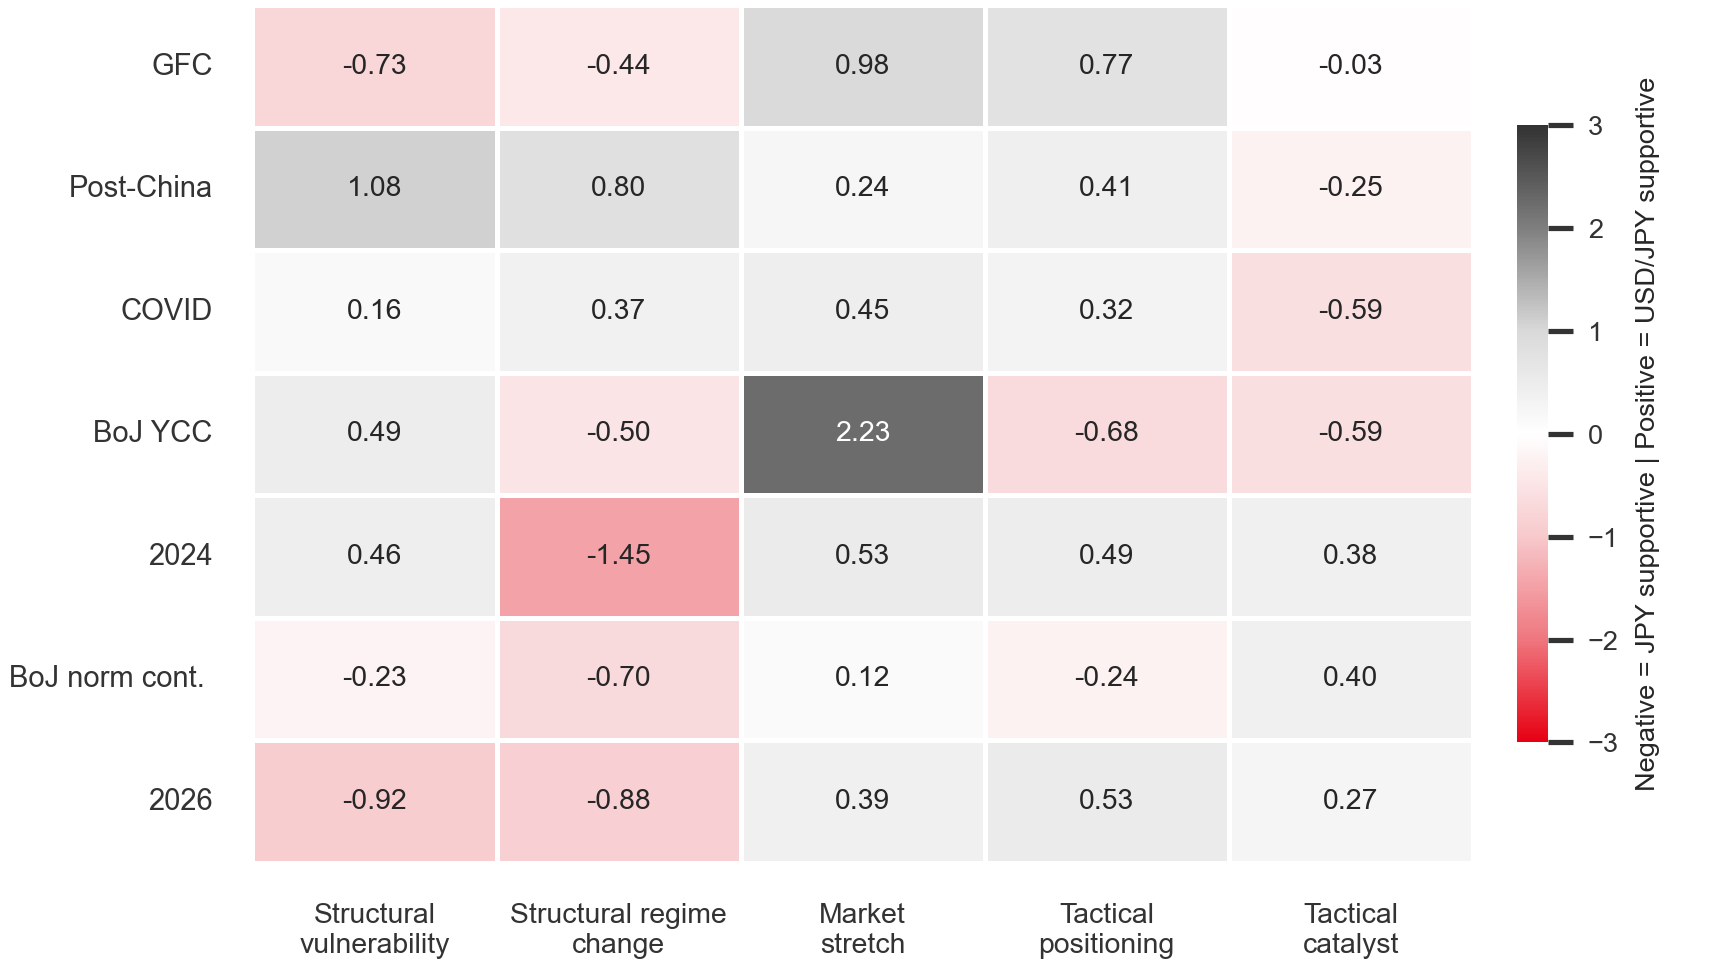
Each variable is transformed into a rolling three-year z-score. All variables are directionally aligned such that positive values indicate conditions supportive of USD/JPY and negative values indicate conditions supportive of JPY appreciation. The indicators are grouped into five pillars:
Structural Vulnerability which measures the degree of support provided by traditional carry dynamics and Japanese overseas capital allocation.
Structural Regime Change which captures evidence of changing monetary conditions through yield levels, yield repricing, changes in cross-market yield differentials and changes in capital allocation.
Market Stretch which assesses the strength of the prevailing USD/JPY trend using momentum measures.
Tactical Positioning which evaluates crowding through futures positioning, carry returns, implied volatility and option risk reversals.
and Tactical Catalysts which capture shocks capable of accelerating reversals, including volatility spikes, equity-market weakness, yield shocks and carry instability.
Together, these indicators provide a comprehensive framework for distinguishing episodes driven primarily by temporary market dynamics from those associated with broader macroeconomic regime change.
How does the ongoing 2026 episode compare against historical episodes?
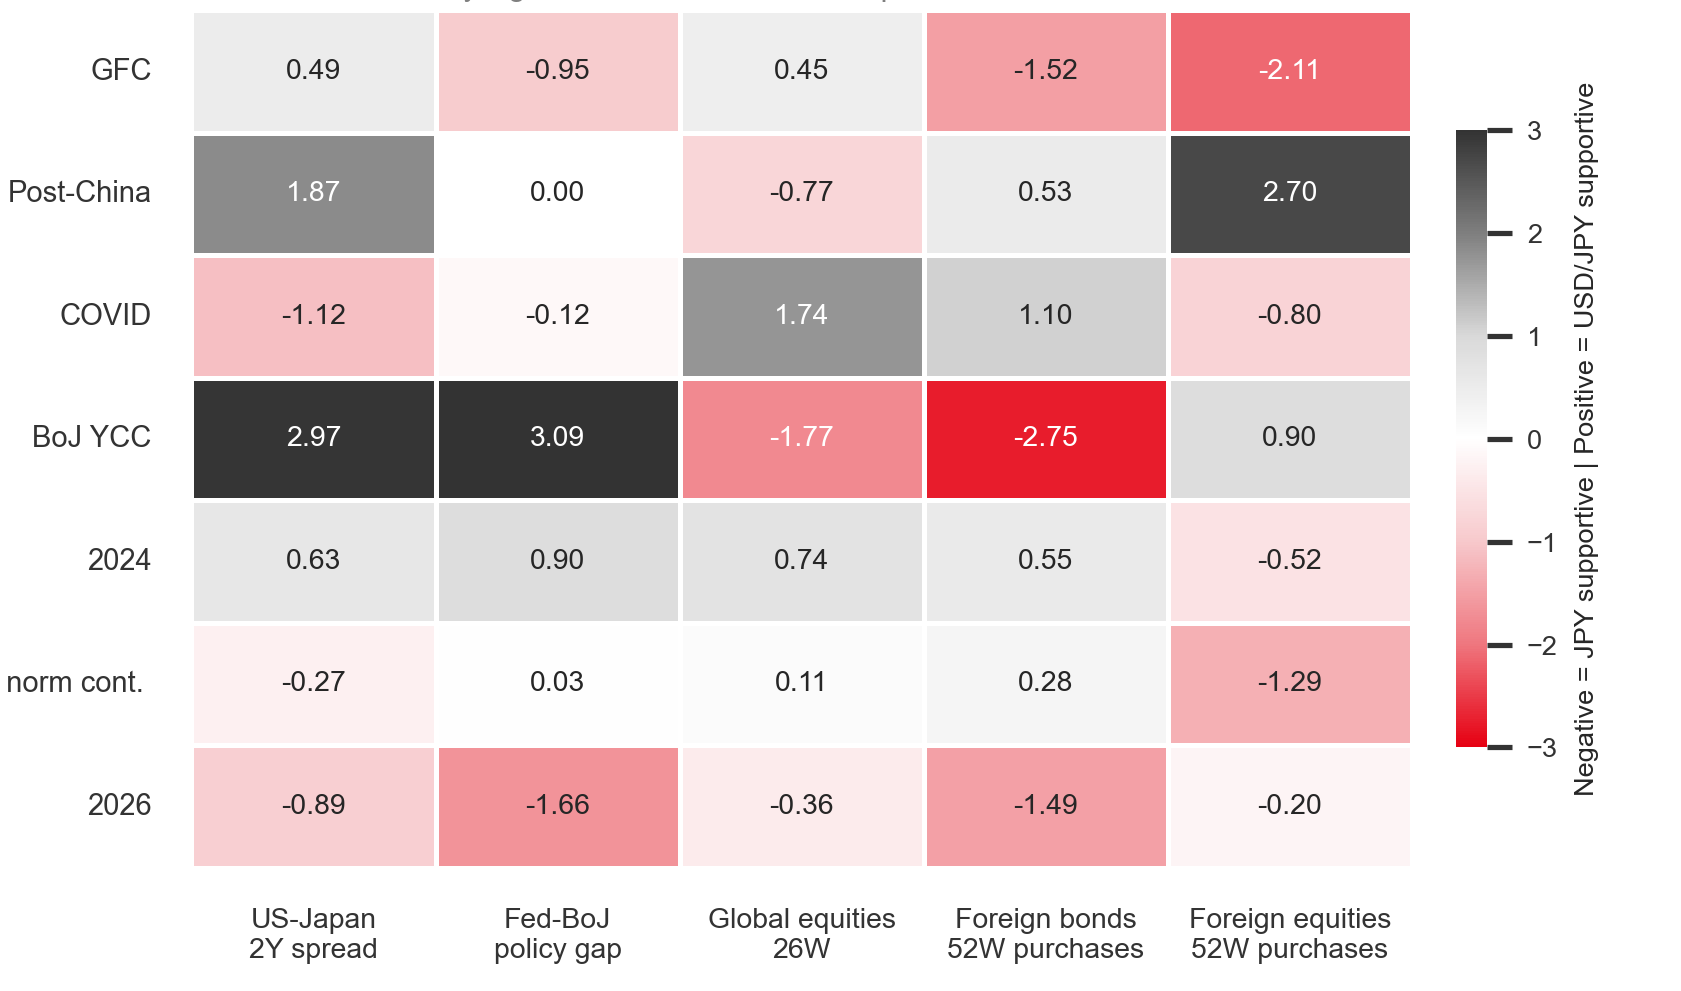
The traditional explanation for cyclical USD/JPY strength revolves around yield differentials, policy divergence and carry attractiveness. Our framework analyses these factors alongside Japanese overseas capital allocation as a proxy for Structural Vulnerability.
The current 2026-episode flags weakness across all sub-categories. This contrast is most notable when compared with the 2024 carry-trade unwind, which generated a 13% appreciation in the yen over two and a half months. Ahead of the 2024 peak, the broader macro backdrop remained supportive of USD/JPY. Yield differentials continued to favour the dollar, policy-rate divergence remained wide, global equity markets were resilient, and Japanese investors continued to allocate capital overseas. The MoF’s intervention in July 2024, aided by a softer-than-expected US CPI release and more hawkish Fed rhetoric, resulted in JPY strength but the underlying drivers supporting USD/JPY remained largely intact.
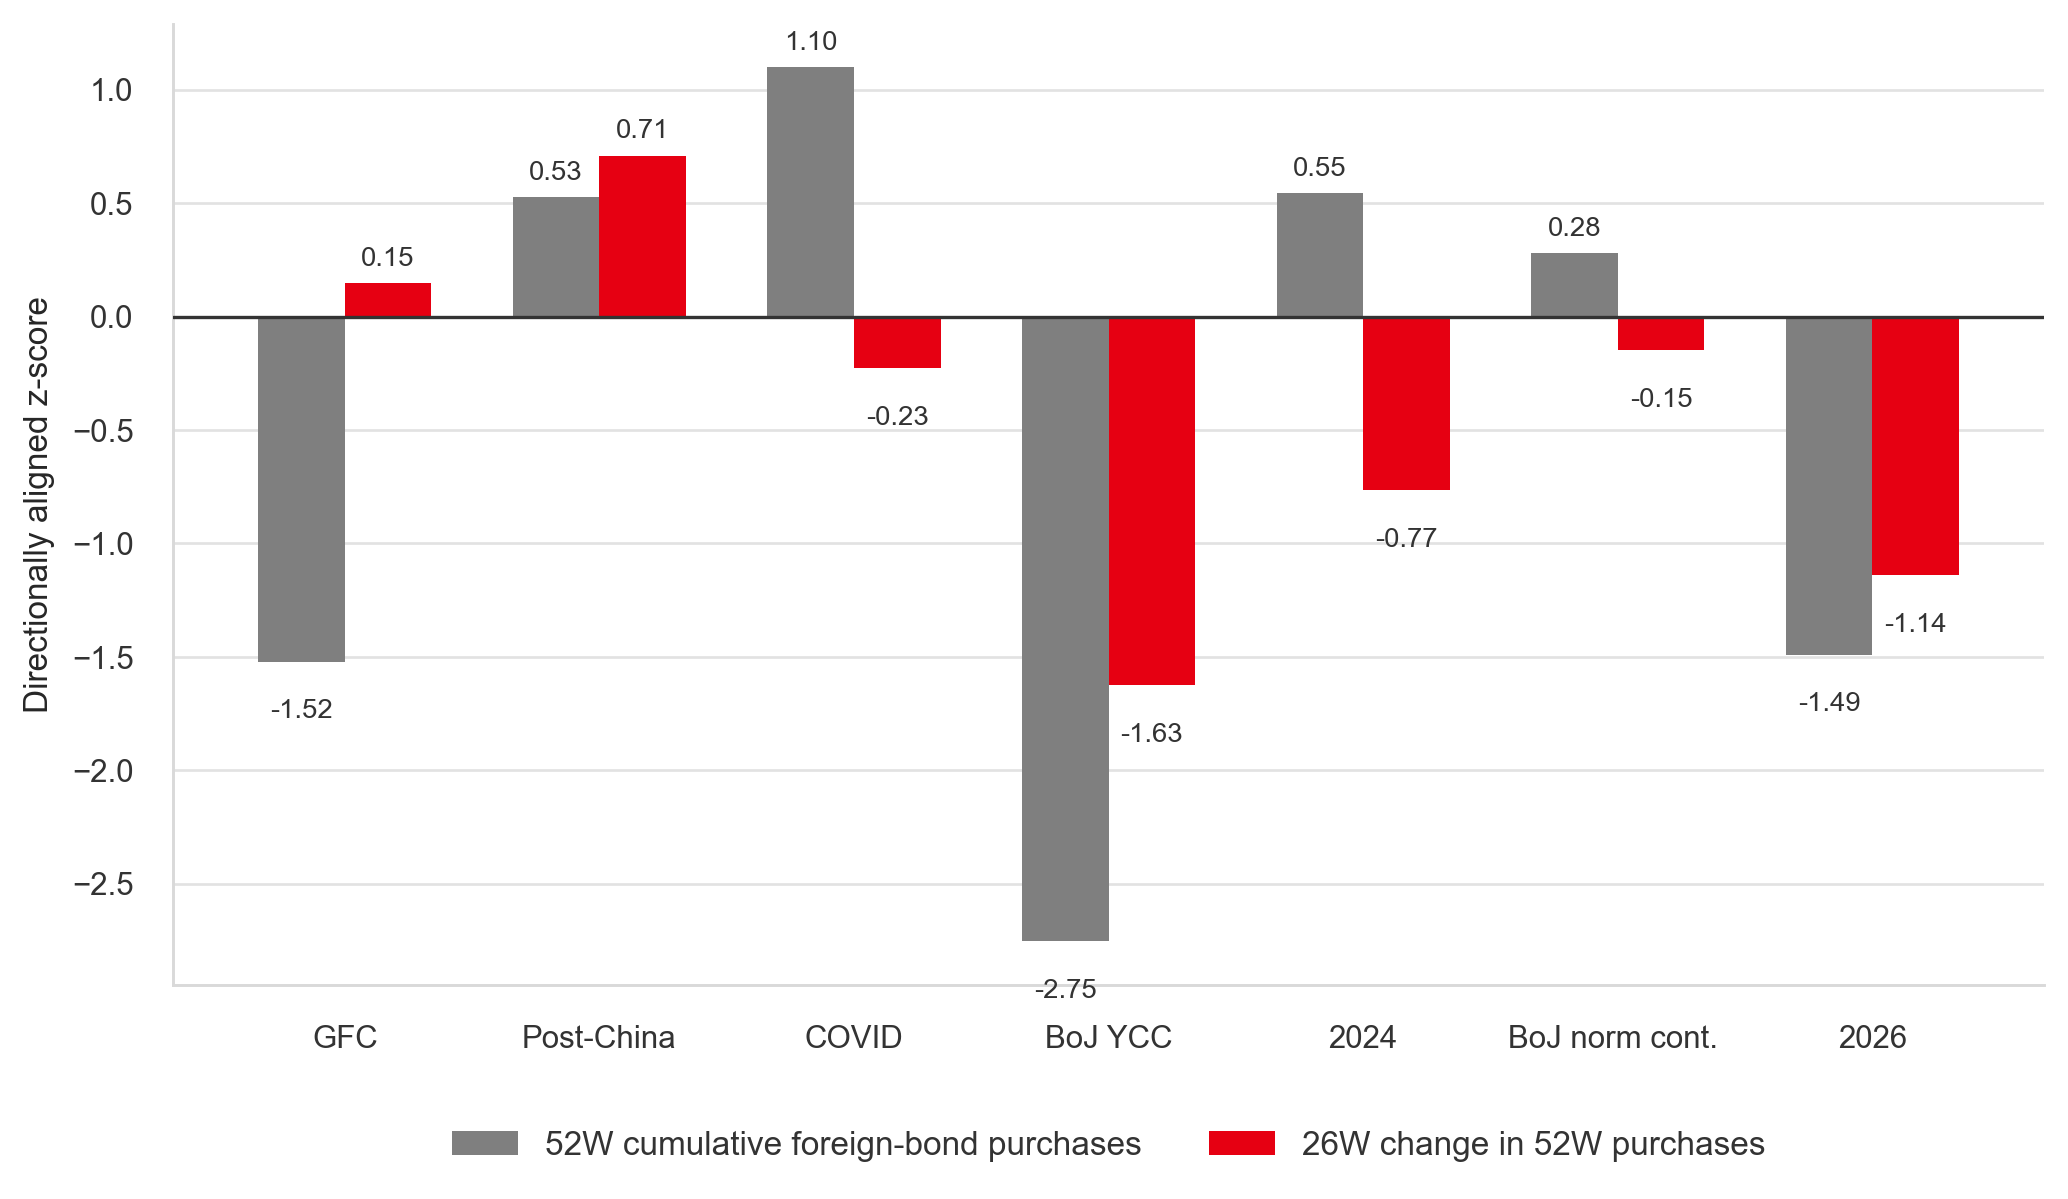
We also note the current episode began after annual foreign-bond purchases had already fallen below normal levels and were continuing to weaken. This does not imply aggressive repatriation. However, it does suggest that one of the key fundamentals supporting USD/JPY has become considerably less supportive. The deterioration in bond allocation represents one of the clearest differences between the current episode and prior short-lived episodes.
CARRY SUPPORT HAS DETERIORATED MORE BROADLY IN 2026 THAN PRIOR
Source: Bloomberg, Macrobond & MUFG GMR
JAPANESE BOND ALLOCATION HAS BECOME MATERIALLY LESS SUPPORTIVE
5-Pillar Framework
One of the clearest conclusions from the framework is that no single indicator reliably predicts duration. However, the current 2026 correction stands out because the deterioration is concentrated in factors most closely linked to the long-term trend. Referencing our 5-pillar framework, the current correction is not characterised by unusually extreme market stretch, positioning or volatility conditions. Instead, it is distinguished by simultaneous deterioration in both Structural Vulnerability and Structural Regime Change factors. This contrasts with the 2024 carry unwind, where underlying carry, policy divergence and capital-export dynamics remained broadly supportive of USD/JPY despite the correction. The current episode therefore appears less consistent with a temporary positioning-driven setback and more consistent with a gradual erosion of the macro and capital-flow foundations.
STRUCTURAL USD/JPY SUPPORT HAS DETERIORATED
Source: Bloomberg, Macrobond & MUFG GMR
Conclusion
The current 2026 episode appears distinct because deterioration has been concentrated in structural features that have historically been required for USD/JPY appreciation.
First, traditional carry support has weakened materially. The US-Japan 10-year nominal yield differential is now significantly narrower (~209bps) than during the peak years of the carry trade in 2022 to 2023 (~399bps), while JGBs have climbed to levels not seen in more than three decades. As domestic yields become increasingly competitive, increasing the risk of repatriation flows.
Second, overseas investment flows have become less supportive for USD/JPY. Our rolling 52-week measure of Japanese net foreign asset purchases has fallen to new lows, suggesting a reduced appetite from market participant to allocate capital into overseas markets.
At the same time, measures of relative monetary policy and macroeconomic conditions have become less favourable than before previous short-lived yen appreciation episodes. The Bank of Japan's decision to raise rates to 1.25% in September 2026, the highest policy rate since 1995, reinforced the view that the tightening cycle is both genuine and ongoing. Unlike earlier periods of yield differential compression, when BoJ policy remained constrained by YCC or near-zero rates, the July 2026 peak occurred against the backdrop of a credible and continuing normalisation cycle.
There is also a political narrative shift. Recent US-Japan discussions have introduced a bilateral political dimension to USD/JPY management that was largely absent during previous episodes. As a result, carry traders face a more complex risk environment, with concerns extending beyond BoJ rate hikes to the possibility of further coordinated intervention.
That said, the framework does not provide definitive evidence that the current move will evolve into a prolonged, multi-year appreciation cycle. A sustained yen rally would likely require a combination of further BoJ tightening further and a meaningful reversal of current market pricing of active Fed monetary tightening. Market participants should therefore remain open to the possibility that the current appreciation phase proves more persistent than the short-lived episodes that were ultimately resolved through positioning adjustment alone. While it remains too early to declare the beginning of a new structural regime, the evidence argues against dismissing the move as simply another short-lived carry-trade unwind.