Jobs in focus as White House confirms tariff rates
USD: Jobs data to endorse FOMC’s stance?
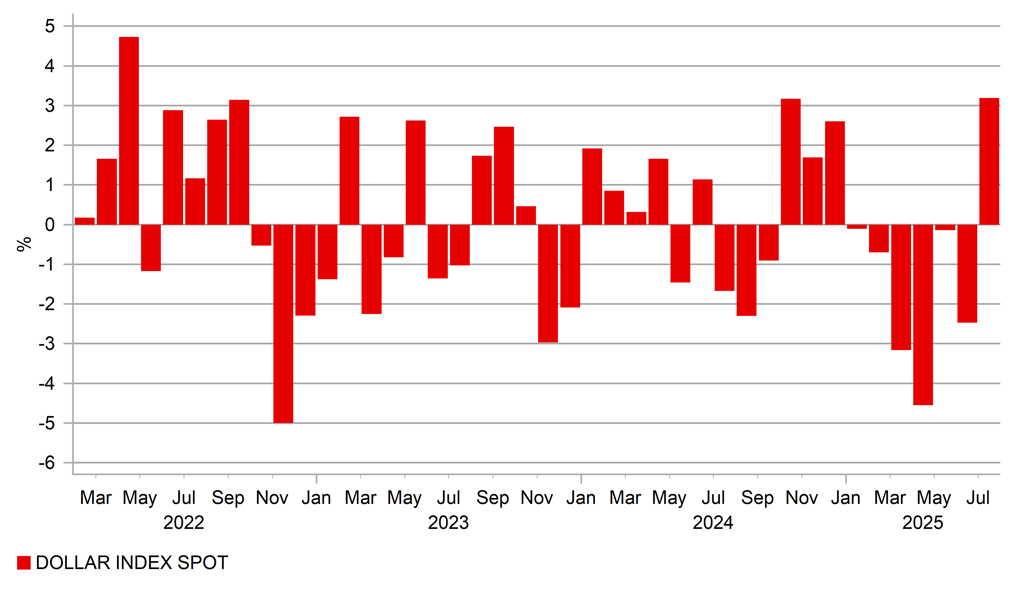
The US dollar in July had its biggest monthly advance (DXY 3.19%) since April 2022 as market participants position for the US economy being better placed to weather the tariff plans announced throughout the month of July that were published by the White House yesterday and will be effective 7th August. A flurry of last-minute deals with a number of Asian countries including South Korea and a 90-day extension of the current status quo for Mexico means fears over damage to the US economy have receded for now as worst case scenarios for most major economies were avoided. The FOMC meeting on Wednesday saw the majority of the committee believe there is time to assess the inflation risks before altering the current monetary stance.
The primary logic in believing there is time to wait has been the resilience of the labour market. The data released yesterday provided further evidence of that resilience with the initial claims data remaining lower than expected at 218k. It’s the second consecutive week below the 220k level for the first time since January. The Challenger lay-off data did indicate job cuts could be coming that could lift initial claims but overall the market continues to show a degree of resilience that suggests no imminent turn weaker for the jobs market. Indeed, the 62k job cut announcements reported was broadly in line with the average in the post-covid period commencing in 2021. The Employment Cost Index data for Q2 yesterday also didn’t suggest a weakening labour market. The Q/Q gain of 0.9% was stronger than expected with the annual rate unchanged at 3.6%. Private sector wages and salaries increased 1.0% with the annual rate ticking slightly higher from 3.4% to 3.5%. The data is consistent with a labour market that is stable rather than deteriorating.
Today’s NFP data will be key as always and with trade risks likely receding as a focus for the markets, relative macro will be more important for FX. For much of the period since ‘Liberation Day’, the rate spread FX correlation has been weak or unstable. The period ahead may well see the correlation reassert itself again.
The market expects a further slowdown in NFP from 147k in June to 105k in July. Last month saw a hefty increase in government jobs that meant private payrolls gained by just 74k. If you then strip out education and health, the private sector cyclical employment rate was just 23k. So there will be two aspects to this report to assess – the headline rate of jobs growth but also what the underlying picture looks like. Ultimately though, a headline NFP print south of 75k will likely be needed to see the markets reprice the current degree of monetary easing. A full cut is now only priced by year-end with only 10bps for the next meeting in September. There will be another NFP before that meeting but based on Powell’s communications this week, the FOMC will need to be convinced over labour market weakness if the CPI data continues to indicate evidence of tariff-related inflation pressures in core goods. So the bar feels higher for the dovish market response today given two weak NFPs could well be required to push the FOMC to ease by September. A strong report would likely remove the prospect of a September cut. While the bias therefore may favour US dollar strength, the strong gain in July does suggest positive news is better priced, which will contain the scope for dollar strength today.
MONTH-ON-MONTH US DOLLAR – BIGGEST MONTHLY GAIN SINCE APR 2022

Source: Bloomberg, Macrobond & MUFG GMR
USD: Tariffs go live from 7th August but with limited investor concern
The White House last night published the Executive Order signed by President Trump confirming the updated tariff rates agreed with global trading partners that will go live on 7th August with the tariff rates generally lower than the published rates on 2nd April that sparked a global financial market meltdown. That seems a lifetime ago now given the response this time around has been muted – the S&P 500 fell 0.4% yesterday but is 27% higher than the close on 8th April following the negative market reaction then.
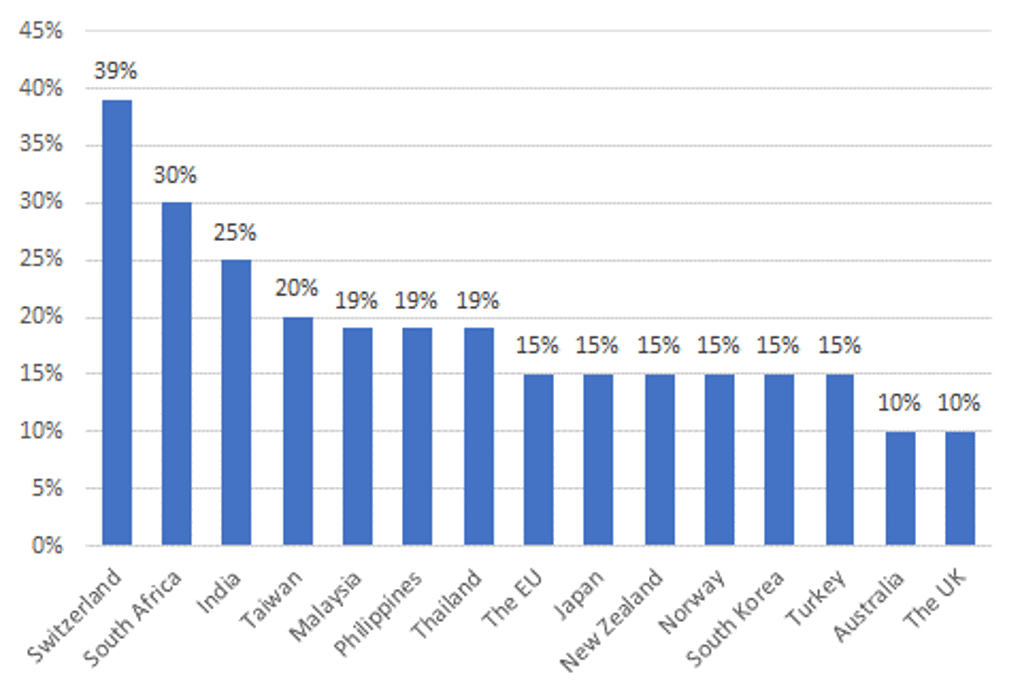
The rates agreed are still significant. Some of the key countries’ levels are highlighted below, but according to Yale University’s Budget Lab in its latest update as of 30th July, the US consumers will now face an overall average effective tariff rate of 18.4%, the highest since 1933. After consumption shifts they estimate the rate will be 17.5%, the highest since 1934. The price level from all the 2025 tariffs implemented increases 1.8% with the average household income loss of USD 2,400. And perhaps the key statistic and the real driver of this policy from the White House is that over the period 2026-2035, the government is estimated to raise USD 2.8trn or after adjusting the negative revenue effect, USD 2.3trn. This estimate is likely marginally higher given the last flurry of deals announced are not included here.
We suspect the lack of more widespread evidence of inflation is down to the front-loading of imports into the US ahead of the expected tariffs going live in Q2 with imports 26% above historical trends. This surge then corrected with imports returning to more normal levels in April and May. Wharton University worked on this issue and estimated that importers managed to avoid tariff costs totalling USD 42.7bn due to front-loading. That won’t be possible going forward and inevitably this cost will likely start to show up much more clearly in the inflation data. We believe the recent data flow reflects more the ability of US companies to avoid tariffs and that there’s no such thing as a free lunch and hence negative implications still lie ahead. While the dollar sell-off in April included a degree of shock and surprise that wont be replicated now, we would still conclude tariffs as ultimately dollar negative over time as it hits real growth, lowers real yields and will encourage portfolio diversification. More domestic-demand orientated policies in Europe and China will also help undermine the dollar.
NEW UPDATED TARIFF RATES - KEY COUNTRIES

Source: White House; 31st July 2025
KEY RELEASES AND EVENTS
|
Country |
BST |
Indicator/Event |
Period |
Consensus |
Previous |
Mkt Moving |
|
GE |
08:55 |
HCOB Germany Manufacturing PMI |
Jul F |
49.2 |
49.2 |
! |
|
EC |
09:00 |
HCOB Eurozone Manufacturing PMI |
Jul F |
49.8 |
49.8 |
! |
|
UK |
09:30 |
S&P Global UK Manufacturing PMI |
Jul F |
48.2 |
48.2 |
! |
|
EC |
10:00 |
CPI Estimate YoY |
Jul P |
1.90% |
2.00% |
!!! |
|
EC |
10:00 |
CPI MoM |
Jul P |
-0.10% |
0.30% |
!!! |
|
EC |
10:00 |
CPI Core YoY |
Jul P |
2.30% |
2.30% |
!!! |
|
US |
13:30 |
Change in Nonfarm Payrolls |
Jul |
104k |
147k |
!!!!! |
|
US |
13:30 |
Change in Private Payrolls |
Jul |
100k |
74k |
!!!! |
|
US |
13:30 |
Average Hourly Earnings MoM |
Jul |
0.30% |
0.20% |
!!! |
|
US |
13:30 |
Average Hourly Earnings YoY |
Jul |
3.80% |
3.70% |
!!! |
|
US |
13:30 |
Average Weekly Hours All Employees |
Jul |
34.2 |
34.2 |
!! |
|
US |
13:30 |
Unemployment Rate |
Jul |
4.20% |
4.10% |
!!!! |
|
US |
13:30 |
Labor Force Participation Rate |
Jul |
62.30% |
62.30% |
! |
|
US |
14:45 |
S&P Global US Manufacturing PMI |
Jul F |
49.7 |
49.5 |
! |
|
US |
15:00 |
ISM Manufacturing |
Jul |
49.5 |
49 |
!!!! |
|
US |
15:00 |
ISM Prices Paid |
Jul |
70 |
69.7 |
!!! |
|
US |
15:00 |
U. of Mich. Sentiment |
Jul F |
62 |
61.8 |
!! |
|
US |
15:00 |
U. of Mich. 1 Yr Inflation |
Jul F |
4.40% |
4.40% |
! |
|
US |
15:00 |
U. of Mich. 5-10 Yr Inflation |
Jul F |
3.60% |
3.60% |
! |
Source: Bloomberg & Investing.com
